# Technical Data Extraction: Path Length Distributions
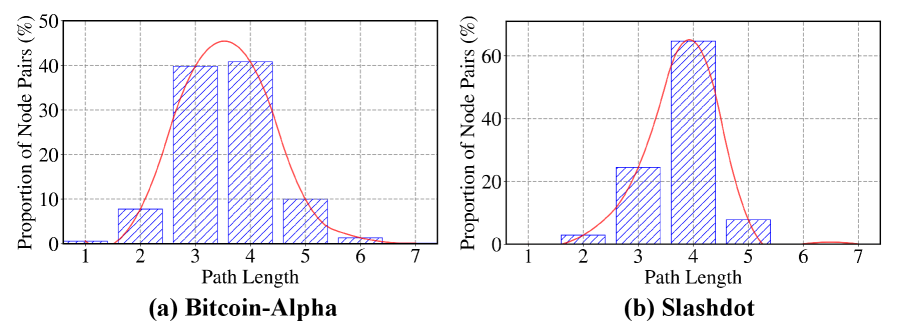
This document contains a detailed extraction of data from two histograms representing the distribution of path lengths in two different network datasets: **Bitcoin-Alpha** and **Slashdot**.
## 1. General Layout and Components
The image consists of two side-by-side subplots, labeled (a) and (b).
* **Y-Axis (Common):** "Proportion of Node Pairs (%)"
* **X-Axis (Common):** "Path Length" (Discrete integer values from 1 to 7)
* **Data Representation:**
* **Blue Hatched Bars:** Represent the empirical frequency of node pairs at a specific path length.
* **Red Solid Line:** Represents a fitted normal distribution curve (probability density function) over the discrete data.
* **Grid:** Both charts feature a dashed gray background grid for value estimation.
---
## 2. Subplot (a): Bitcoin-Alpha
### Metadata
* **Title/Label:** (a) Bitcoin-Alpha
* **X-Axis Range:** 1 to 7
* **Y-Axis Range:** 0 to 50%
### Trend Analysis
The distribution is unimodal and slightly right-skewed. The majority of node pairs have a path length between 3 and 4. The frequency rises sharply from length 2 to 3, peaks between 3 and 4, and tapers off significantly by length 6.
### Data Point Extraction (Estimated)
| Path Length (x) | Proportion of Node Pairs (%) (y) |
| :--- | :--- |
| 1 | ~0.5% |
| 2 | ~8% |
| 3 | ~40% |
| 4 | ~41% |
| 5 | ~10% |
| 6 | ~1.5% |
| 7 | ~0% |
### Curve Characteristics
The red curve peaks at approximately **x = 3.5** with a maximum value of roughly **45%**.
---
## 3. Subplot (b): Slashdot
### Metadata
* **Title/Label:** (b) Slashdot
* **X-Axis Range:** 1 to 7
* **Y-Axis Range:** 0 to 70% (Note: Higher scale than Bitcoin-Alpha)
### Trend Analysis
The distribution is highly concentrated (low variance) compared to Bitcoin-Alpha. It is strongly unimodal with a very sharp peak at path length 4. Almost no node pairs exist at path lengths 1, 6, or 7.
### Data Point Extraction (Estimated)
| Path Length (x) | Proportion of Node Pairs (%) (y) |
| :--- | :--- |
| 1 | ~0% |
| 2 | ~3% |
| 3 | ~25% |
| 4 | ~65% |
| 5 | ~8% |
| 6 | ~0.5% |
| 7 | ~0% |
### Curve Characteristics
The red curve peaks precisely at **x = 4** with a maximum value of approximately **65%**. The curve is narrower than in the Bitcoin-Alpha plot, indicating a more uniform path length across the network.
---
## 4. Comparative Summary
* **Central Tendency:** Both networks exhibit "Small World" properties, with most nodes connected by 3 to 4 hops.
* **Concentration:** The **Slashdot** network is more tightly clustered around a path length of 4, whereas **Bitcoin-Alpha** has a more even distribution between lengths 3 and 4.
* **Network Reach:** In both datasets, it is extremely rare for node pairs to have a shortest path length greater than 6.