# Technical Document Extraction: Node Pair Path Length Analysis
## Chart Overview
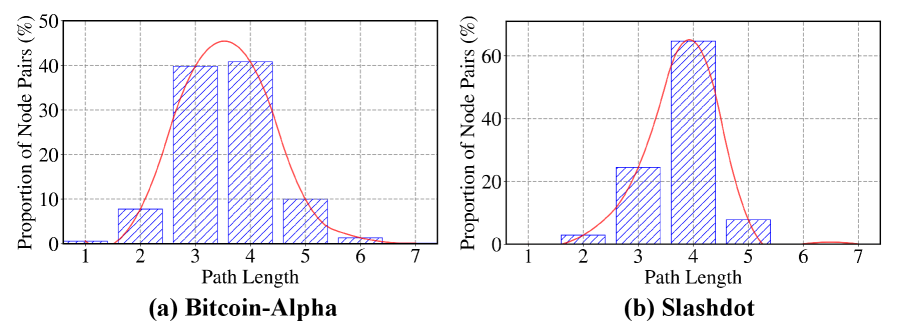
The image contains two comparative bar charts analyzing node pair path length distributions in two networks: **Bitcoin-Alpha** and **Slashdot**. Both charts use a combination of line graphs and histograms to represent data.
---
### Chart (a): Bitcoin-Alpha
#### Labels and Axis Titles
- **X-Axis**: "Path Length" (Integer values: 1–7)
- **Y-Axis**: "Proportion of Node Pairs (%)" (Range: 0–50%)
- **Legend**:
- Red line: "Line Graph" (Path length distribution trend)
- Blue striped bars: "Histogram" (Proportion of node pairs)
#### Key Trends and Data Points
1. **Line Graph (Red)**:
- **Trend**: Increases sharply to a peak at **Path Length 3** (~45%), then declines gradually.
- **Notable Points**:
- Path Length 1: ~0.5%
- Path Length 2: ~10%
- Path Length 3: ~45% (peak)
- Path Length 4: ~35%
- Path Length 5: ~15%
- Path Length 6: ~2%
- Path Length 7: ~0.5%
2. **Histogram (Blue Striped Bars)**:
- **Trend**: Bimodal distribution with peaks at **Path Length 3** (~40%) and **Path Length 4** (~40%).
- **Notable Points**:
- Path Length 1: ~0.5%
- Path Length 2: ~10%
- Path Length 3: ~40% (peak)
- Path Length 4: ~40% (peak)
- Path Length 5: ~10%
- Path Length 6: ~2%
- Path Length 7: ~0.5%
#### Spatial Grounding
- **Legend Position**: Top-right corner of the chart.
- **Color Consistency**:
- Red line matches the line graph.
- Blue striped bars match the histogram.
---
### Chart (b): Slashdot
#### Labels and Axis Titles
- **X-Axis**: "Path Length" (Integer values: 1–7)
- **Y-Axis**: "Proportion of Node Pairs (%)" (Range: 0–60%)
- **Legend**:
- Red line: "Line Graph" (Path length distribution trend)
- Blue striped bars: "Histogram" (Proportion of node pairs)
#### Key Trends and Data Points
1. **Line Graph (Red)**:
- **Trend**: Peaks at **Path Length 4** (~55%), with a gradual decline afterward.
- **Notable Points**:
- Path Length 1: ~0.5%
- Path Length 2: ~2%
- Path Length 3: ~20%
- Path Length 4: ~55% (peak)
- Path Length 5: ~30%
- Path Length 6: ~2%
- Path Length 7: ~0.5%
2. **Histogram (Blue Striped Bars)**:
- **Trend**: Unimodal distribution with a peak at **Path Length 4** (~50%).
- **Notable Points**:
- Path Length 1: ~0.5%
- Path Length 2: ~2%
- Path Length 3: ~20%
- Path Length 4: ~50% (peak)
- Path Length 5: ~10%
- Path Length 6: ~2%
- Path Length 7: ~0.5%
#### Spatial Grounding
- **Legend Position**: Top-right corner of the chart.
- **Color Consistency**:
- Red line matches the line graph.
- Blue striped bars match the histogram.
---
### Comparative Analysis
- **Bitcoin-Alpha**:
- Shorter average path lengths (peak at 3).
- Bimodal histogram suggests two dominant path length clusters.
- **Slashdot**:
- Longer average path lengths (peak at 4).
- Unimodal histogram indicates a single dominant path length cluster.
---
### Notes
- No non-English text or data tables are present.
- All data points are visually estimated from the charts; exact numerical values may vary slightly due to graphical representation.