## Diagram: Synaptic Plasticity and Neuronal Network Response
### Overview
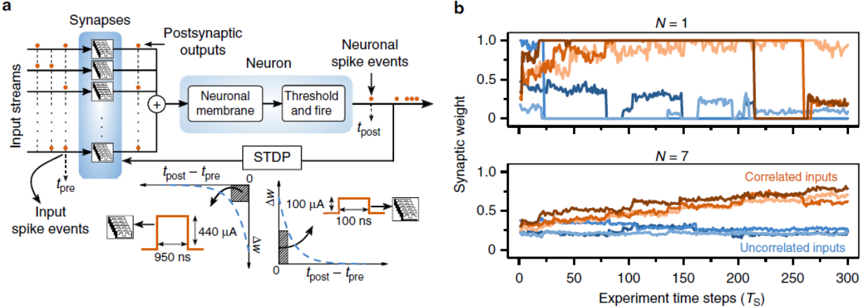
The image presents a diagram illustrating the process of synaptic plasticity, specifically Spike-Timing-Dependent Plasticity (STDP), and its effect on synaptic weights within neuronal networks. The diagram is split into two main sections: (a) a schematic of the synaptic process and (b) graphs showing synaptic weight changes for different network sizes and input correlations.
### Components/Axes
**Section (a): Synaptic Process Schematic**
* **Input streams:** Represented by multiple lines converging into synapses.
* **Synapses:** Illustrated as small squares connecting input streams to the neuron.
* **Postsynaptic outputs:** Depicted as a neuron with a "Neuronal membrane" component and a "Threshold and fire" mechanism.
* **Neuronal spike events:** Shown as output signals from the neuron.
* **STDP:** A graph illustrating the change in synaptic weight (ΔW) as a function of the time difference between pre- and post-synaptic spikes (t<sub>post</sub> - t<sub>pre</sub>).
* **Input spike events:** Represented by waveforms with a duration of 950 ns.
* **Current waveforms:** Two waveforms representing current changes, one with 440 μA and a duration of 100 ns, and another with 100 μA and a duration of 100 ns.
**Section (b): Synaptic Weight Graphs**
* **X-axis:** "Experiment time steps (T<sub>s</sub>)" ranging from 0 to 300.
* **Y-axis:** "Synaptic weight" ranging from 0 to 1.0.
* **Top Graph (N = 1):** Shows synaptic weight changes for a network with one neuron. Two lines are present:
* Orange line: Represents correlated inputs.
* Blue line: Represents uncorrelated inputs.
* **Bottom Graph (N = 7):** Shows synaptic weight changes for a network with seven neurons. Two lines are present:
* Orange line: Represents correlated inputs.
* Blue line: Represents uncorrelated inputs.
* **Gray shaded regions:** Indicate periods of input stimulation.
### Detailed Analysis or Content Details
**Section (a): Synaptic Process Schematic**
* The diagram shows input streams converging onto synapses, which then stimulate a neuron.
* The STDP graph illustrates that if the pre-synaptic spike occurs *before* the post-synaptic spike (positive t<sub>post</sub> - t<sub>pre</sub>), the synaptic weight increases (positive ΔW). Conversely, if the pre-synaptic spike occurs *after* the post-synaptic spike (negative t<sub>post</sub> - t<sub>pre</sub>), the synaptic weight decreases (negative ΔW).
* The current waveforms show the magnitude and duration of current changes associated with synaptic events.
**Section (b): Synaptic Weight Graphs**
* **N = 1 (Top Graph):**
* The orange line (correlated inputs) starts at approximately 0.8 and fluctuates around 0.9, with dips coinciding with the gray shaded regions. It ends at approximately 0.85.
* The blue line (uncorrelated inputs) starts at approximately 0.5 and decreases to around 0.3 during the first shaded region, then fluctuates between 0.3 and 0.5, ending at approximately 0.35.
* **N = 7 (Bottom Graph):**
* The orange line (correlated inputs) starts at approximately 0.8 and increases to around 0.95, then fluctuates around 0.85-0.95, ending at approximately 0.9.
* The blue line (uncorrelated inputs) starts at approximately 0.5 and decreases to around 0.3 during the first shaded region, then fluctuates between 0.3 and 0.5, ending at approximately 0.4.
### Key Observations
* STDP leads to an increase in synaptic weight when the pre-synaptic spike precedes the post-synaptic spike, and a decrease when it follows.
* Correlated inputs tend to strengthen synaptic weights over time, while uncorrelated inputs tend to weaken them.
* The effect of correlated inputs is more pronounced in larger networks (N = 7) compared to smaller networks (N = 1).
* Uncorrelated inputs consistently lead to a decrease in synaptic weight.
### Interpretation
The diagram demonstrates how STDP can contribute to the formation of stable neuronal networks. The strengthening of synapses due to correlated inputs suggests a mechanism for learning and memory, where neurons that fire together wire together. The weakening of synapses due to uncorrelated inputs helps to prune irrelevant connections, improving the efficiency of the network. The larger network (N = 7) shows a more robust strengthening of correlated synapses, indicating that network size can amplify the effects of STDP. The gray shaded regions represent periods of stimulation, and the corresponding dips in synaptic weight for uncorrelated inputs suggest that repeated stimulation without correlation can lead to synaptic depression. This model provides a biologically plausible mechanism for synaptic plasticity and its role in neural computation.