## Diagram: Neural Network Model with Synaptic Timing-Dependent Plasticity (STDP)
### Overview
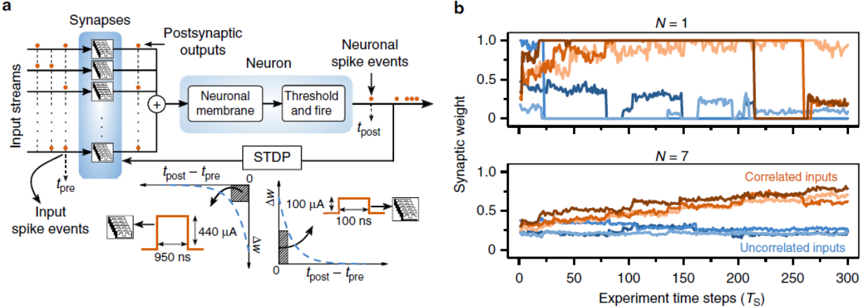
The image depicts a computational model of a neuron and its synapses, illustrating synaptic plasticity mechanisms. It includes input streams, synaptic processing, neuronal spiking, and STDP dynamics. Two graphs (b) show synaptic weight evolution over time for different input configurations.
---
### Components/Axes
#### Diagram (a)
- **Input Streams**: Labeled with "Input spike events" (orange dots) and timing parameters (`t_pre`, `t_post`).
- **Synapses**: Represented as a vertical column with "Postsynaptic outputs" arrows.
- **Neuron**: Contains "Neuronal membrane" and "Threshold and fire" logic.
- **STDP Mechanism**:
- Time difference: `t_post - t_pre` (x-axis).
- Synaptic weight change (ΔW) with arrows indicating potentiation/depression.
- Synaptic weight update: `100 μA` (input) and `440 μA` (output) with 950 ns and 100 ns delays.
- **Output**: "Neuronal spike events" (orange dots) post-threshold.
#### Graphs (b)
- **X-axis**: "Experiment time steps (T_S)" (0–300).
- **Y-axis**: "Synaptic weight" (0–1.0).
- **Legends**:
- **Top Graph (N=1)**:
- Orange: "Correlated inputs"
- Blue: "Uncorrelated inputs"
- **Bottom Graph (N=7)**:
- Red: "Correlated inputs"
- Blue: "Uncorrelated inputs"
---
### Detailed Analysis
#### Diagram (a)
- **Input Spike Events**:
- Pre-synaptic (`t_pre`): 950 ns duration, 440 μA amplitude.
- Post-synaptic (`t_post`): 100 ns duration, 100 μA amplitude.
- **STDP Dynamics**:
- Synaptic weight change (ΔW) depends on `t_post - t_pre`:
- Positive ΔW (potentiation) for `t_post > t_pre`.
- Negative ΔW (depression) for `t_post < t_pre`.
- Threshold firing (`t_post`) triggers neuronal spiking.
#### Graphs (b)
- **N=1 (Top Graph)**:
- **Correlated inputs (orange)**:
- Synaptic weight fluctuates between 0.5–1.0, with a sharp drop at T_S=200.
- Post-drop stabilization near 0.3.
- **Uncorrelated inputs (blue)**:
- Stable synaptic weight (~0.2–0.4) with minor fluctuations.
- **N=7 (Bottom Graph)**:
- **Correlated inputs (red)**:
- Gradual increase from 0.3 to 0.7 over 300 T_S steps.
- **Uncorrelated inputs (blue)**:
- Flat synaptic weight (~0.1–0.2) with no significant change.
---
### Key Observations
1. **STDP Mechanism**: Synaptic weight changes are directly tied to the timing difference between pre- and post-synaptic spikes.
2. **Input Correlation Impact**:
- Correlated inputs (N=1 and N=7) show larger synaptic weight changes compared to uncorrelated inputs.
- Higher N (N=7) amplifies the effect of correlated inputs, suggesting scalability of STDP with input correlation.
3. **N=1 Anomaly**: Sharp synaptic weight drop at T_S=200 may indicate threshold saturation or reset mechanisms.
---
### Interpretation
The model demonstrates how synaptic plasticity (STDP) enables neurons to adapt based on input timing correlations. Correlated inputs drive stronger synaptic weight changes, implying that neural networks prioritize temporally aligned signals for learning. The N=7 graph highlights that increased input correlation enhances plasticity, supporting theories of Hebbian learning ("cells that fire together, wire together"). The N=1 anomaly suggests additional regulatory mechanisms (e.g., synaptic saturation) not explicitly modeled in the diagram. These findings align with biological neural plasticity principles, where correlated activity strengthens synapses, forming the basis for memory and learning.