## Diagram: Simple Directed Acyclic Graph
### Overview
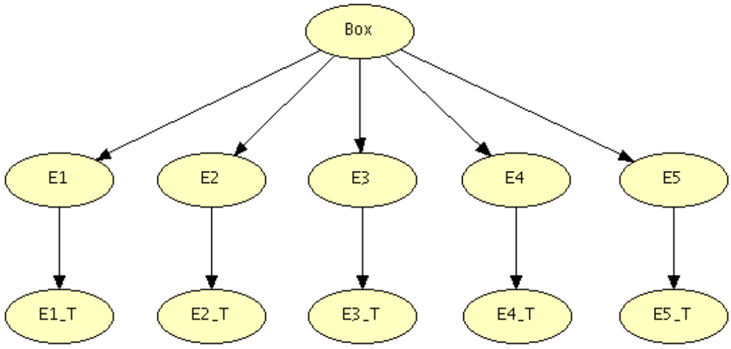
The image is a simple directed acyclic graph (DAG) consisting of nodes and directed edges (arrows). The graph represents a hierarchical relationship, with a single root node labeled "Box" at the top, branching down to five intermediate nodes (E1 to E5), and then further down to five terminal nodes (E1_T to E5_T). All nodes are represented as yellow ovals.
### Components/Axes
* **Nodes:**
* **Root Node:** "Box" (located at the top-center)
* **Intermediate Nodes:** E1, E2, E3, E4, E5 (arranged horizontally in the middle layer)
* **Terminal Nodes:** E1_T, E2_T, E3_T, E4_T, E5_T (arranged horizontally in the bottom layer)
* **Edges:** Directed arrows indicating the flow of influence or dependency.
* From "Box" to each of E1, E2, E3, E4, E5.
* From each of E1, E2, E3, E4, E5 to their respective terminal nodes E1_T, E2_T, E3_T, E4_T, E5_T.
### Detailed Analysis or ### Content Details
* **Node "Box":** Located at the top center of the diagram. It has five outgoing edges, each pointing to one of the intermediate nodes (E1 to E5).
* **Nodes E1 to E5:** These nodes are arranged horizontally in the middle of the diagram. Each node has one incoming edge from the "Box" node and one outgoing edge to its corresponding terminal node.
* E1 is connected to E1_T.
* E2 is connected to E2_T.
* E3 is connected to E3_T.
* E4 is connected to E4_T.
* E5 is connected to E5_T.
* **Nodes E1_T to E5_T:** These nodes are arranged horizontally at the bottom of the diagram. Each node has one incoming edge from its corresponding intermediate node.
### Key Observations
* The graph is a tree-like structure with a single root.
* Each intermediate node (E1 to E5) has a direct dependency on the root node "Box".
* Each terminal node (E1_T to E5_T) has a direct dependency on its corresponding intermediate node.
* There are no cycles in the graph, confirming it is a DAG.
### Interpretation
The diagram represents a hierarchical relationship where the "Box" node influences or determines the states of E1 through E5. Subsequently, each of E1 through E5 influences or determines the states of E1_T through E5_T, respectively. This could represent a decision-making process, a causal relationship, or a data flow. The specific meaning depends on the context in which this diagram is used. The structure suggests that the "Box" node is a central factor that branches out into different possibilities or outcomes (E1-E5), which then lead to further specific results (E1_T-E5_T).