# Technical Document Extraction: Line Graph Analysis
## Chart Type
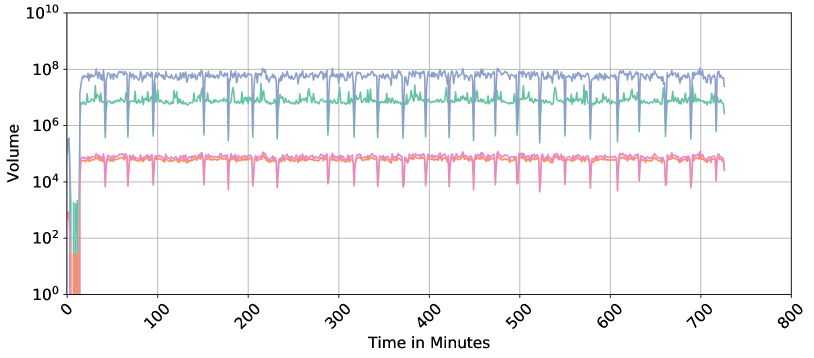
- **Line Graph** with logarithmic y-axis and linear x-axis.
## Axis Labels
- **X-axis**: "Time in Minutes" (linear scale, 0 to 800).
- **Y-axis**: "Volume" (logarithmic scale, 10⁰ to 10¹⁰).
## Legend
- **Placement**: Right side of the chart.
- **Labels**:
- **Blue**: Data Series A
- **Green**: Data Series B
- **Pink**: Data Series C
- **Orange**: Data Series D
## Data Series Analysis
### Data Series A (Blue)
- **Trend**: Highest magnitude, fluctuating between **10⁸** and **10⁹**.
- **Pattern**: Periodic spikes with consistent amplitude (~10⁸ baseline, peaks ~10⁹).
- **Key Observations**:
- Spikes occur at regular intervals (~every 50 minutes).
- No significant decay over time.
### Data Series B (Green)
- **Trend**: Second-highest magnitude, fluctuating between **10⁶** and **10⁷**.
- **Pattern**: Periodic spikes with smaller amplitude than Series A (~10⁶ baseline, peaks ~10⁷).
- **Key Observations**:
- Spikes align with Series A but at lower magnitude.
- Slightly more erratic baseline compared to Series A.
### Data Series C (Pink)
- **Trend**: Moderate magnitude, fluctuating between **10⁴** and **10⁵**.
- **Pattern**: Periodic spikes with minimal amplitude (~10⁴ baseline, peaks ~10⁵).
- **Key Observations**:
- Spikes less frequent than Series A/B (~every 100 minutes).
- Baseline remains stable.
### Data Series D (Orange)
- **Trend**: Lowest magnitude, fluctuating between **10²** and **10³**.
- **Pattern**: Periodic spikes with negligible amplitude (~10² baseline, peaks ~10³).
- **Key Observations**:
- Spikes least frequent (~every 200 minutes).
- Baseline nearly flat.
## Key Observations
1. **Magnitude Hierarchy**:
- Series A > Series B > Series C > Series D.
2. **Temporal Correlation**:
- Spikes in Series A and B are temporally aligned but differ in magnitude.
- Series C and D exhibit delayed or dampened responses relative to A/B.
3. **Logarithmic Scale Implications**:
- Y-axis compression emphasizes relative differences in magnitude.
- Small absolute changes in lower series (C/D) appear visually insignificant.
## Spatial Grounding
- **Legend Position**: Right-aligned, adjacent to the chart.
- **Color Consistency**:
- Blue (A) ≠ Green (B) ≠ Pink (C) ≠ Orange (D).
- No overlapping colors or mislabeling detected.
## Trend Verification
- **Series A**: Upward spikes dominate; no downward trend.
- **Series B**: Similar spike pattern to A but lower amplitude.
- **Series C/D**: Subtle oscillations; no sustained growth/decay.
## Conclusion
The graph depicts four distinct data series with hierarchical magnitudes and periodic behavior. Higher-series data (A/B) exhibit synchronized but scaled fluctuations, while lower-series data (C/D) show dampened or delayed responses. The logarithmic y-axis highlights exponential differences in volume across series.