## Line Chart: Success Rate vs. Number of Actions
### Overview
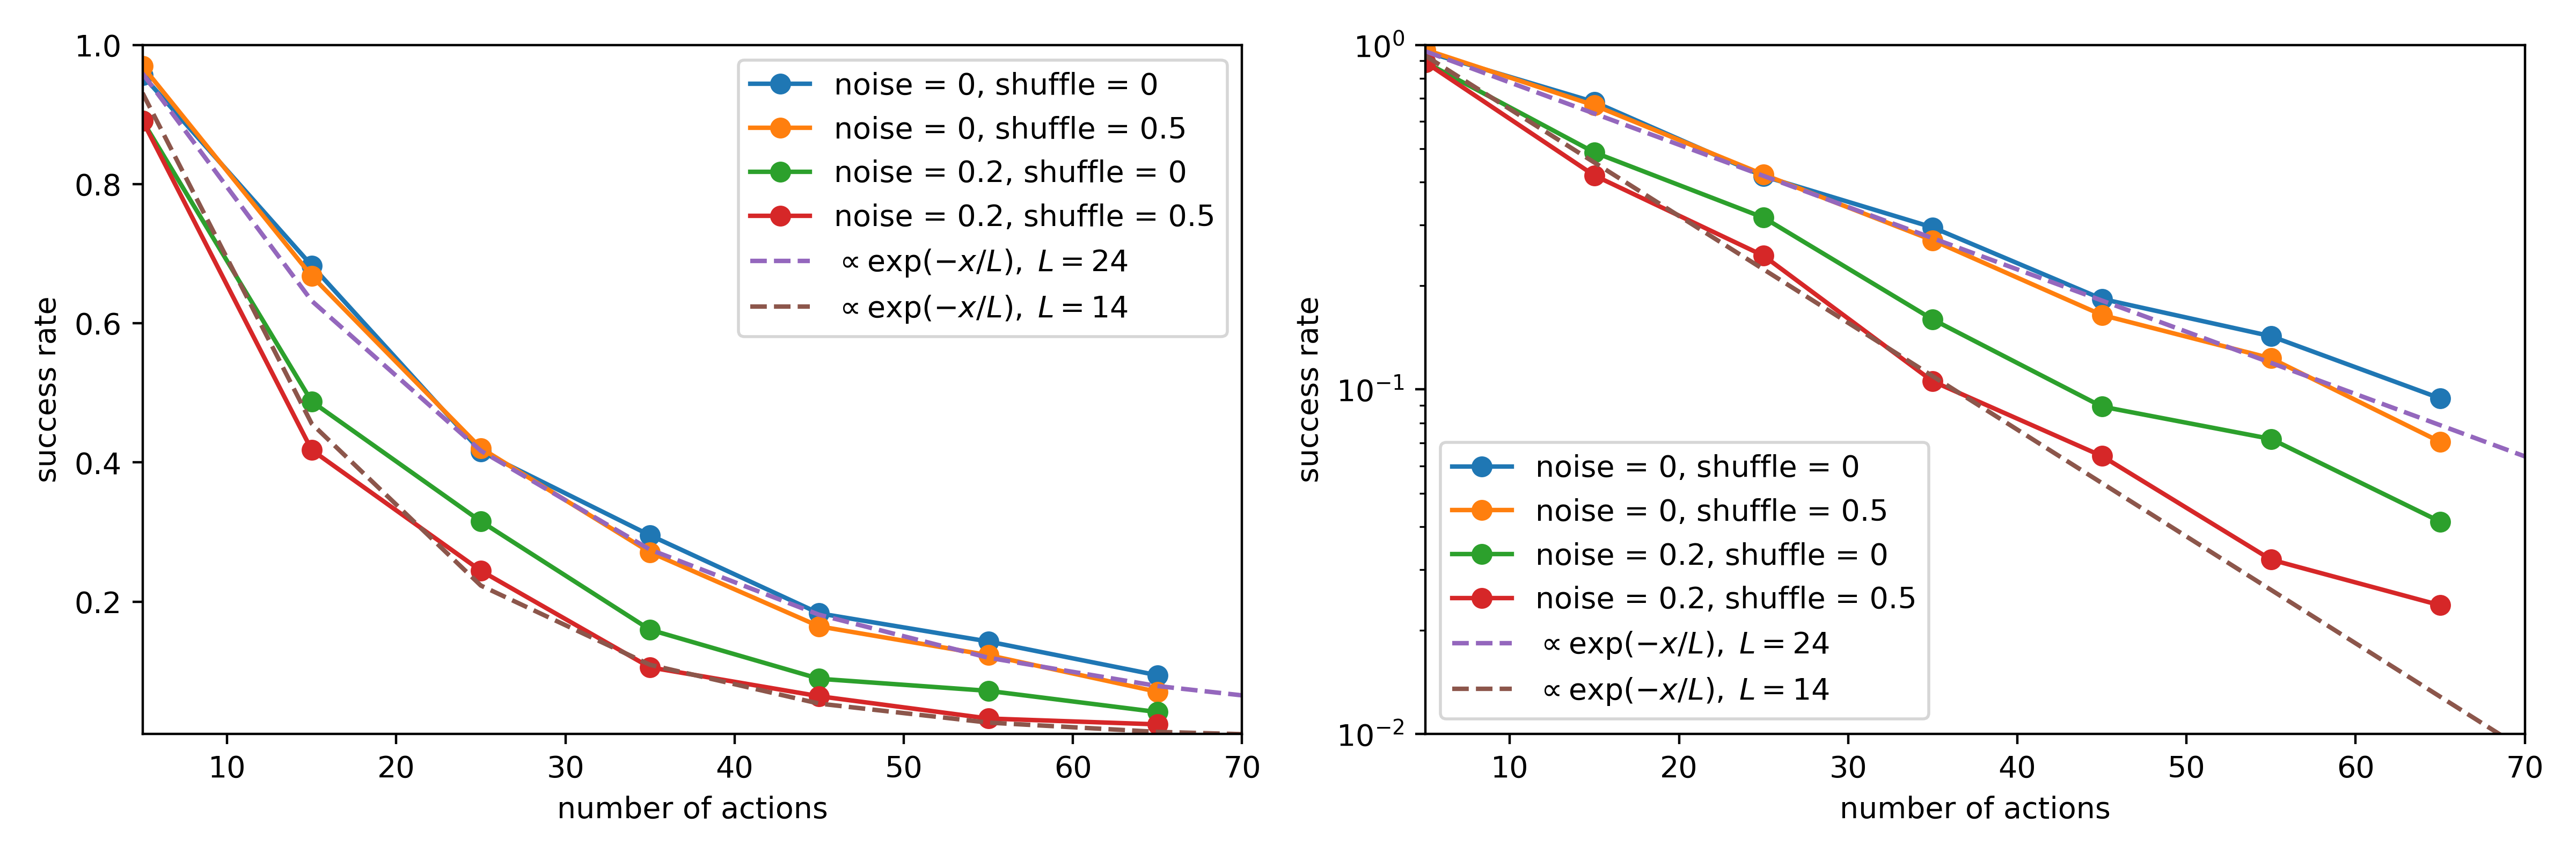
The image contains two line charts comparing success rates across different noise and shuffle conditions. The left chart uses a linear y-axis (success rate) and linear x-axis (number of actions), while the right chart uses a log-log scale for both axes. Exponential decay models (α exp(-x/L)) are overlaid for comparison.
### Components/Axes
- **Left Chart**:
- **Y-axis**: "success rate" (linear scale: 0.01–1.0)
- **X-axis**: "number of actions" (linear scale: 10–70)
- **Legend**:
- Blue: noise = 0, shuffle = 0
- Orange: noise = 0, shuffle = 0.5
- Green: noise = 0.2, shuffle = 0
- Red: noise = 0.2, shuffle = 0.5
- Purple dashed: α exp(-x/L), L = 24
- Brown dashed: α exp(-x/L), L = 14
- **Right Chart**:
- **Y-axis**: "success rate" (logarithmic scale: 10⁻²–10⁰)
- **X-axis**: "number of actions" (logarithmic scale: 10–70)
- **Legend**: Same as left chart.
### Detailed Analysis
#### Left Chart Trends
1. **Blue Line (noise=0, shuffle=0)**:
- Starts at ~0.95 success rate at 10 actions.
- Declines gradually to ~0.1 by 70 actions.
- Follows the purple dashed exponential fit (L=24).
2. **Orange Line (noise=0, shuffle=0.5)**:
- Starts at ~0.9 at 10 actions.
- Declines faster than blue, reaching ~0.05 by 70 actions.
- Matches the brown dashed exponential fit (L=14).
3. **Green Line (noise=0.2, shuffle=0)**:
- Starts at ~0.85 at 10 actions.
- Declines to ~0.03 by 70 actions.
- Aligns with the purple dashed line (L=24).
4. **Red Line (noise=0.2, shuffle=0.5)**:
- Starts at ~0.8 at 10 actions.
- Declines steeply to ~0.01 by 70 actions.
- Matches the brown dashed line (L=14).
#### Right Chart Trends
- All lines appear linear due to log-log scaling.
- Exponential fits (purple/brown dashed) become straight lines.
- Relative slopes confirm decay rates: L=24 (shallower slope) vs. L=14 (steeper slope).
### Key Observations
1. **Noise/Shuffle Impact**:
- Higher noise (0.2 vs. 0) reduces success rates by ~10–15% at 10 actions.
- Shuffle=0.5 accelerates decay, halving success rates compared to shuffle=0 at 70 actions.
2. **Exponential Decay**:
- Success rate decays exponentially with actions (α exp(-x/L)).
- L=24 (purple) corresponds to lower noise/shuffle, slower decay.
- L=14 (brown) corresponds to higher noise/shuffle, faster decay.
3. **Consistency**:
- Both charts show identical trends, validating log-log scaling preserves relationships.
### Interpretation
The data demonstrates that **noise and shuffle parameters independently degrade performance**, with combined effects (noise=0.2, shuffle=0.5) causing the steepest decline. The exponential models quantify this decay, where **L=24** (slower decay) aligns with ideal conditions (noise=0, shuffle=0), while **L=14** (faster decay) reflects degraded conditions. The log-log visualization emphasizes multiplicative relationships, confirming that success rate halves every ~14–24 actions depending on conditions. This suggests optimizing noise/shuffle parameters is critical for maintaining performance in action-dependent systems.