## Bar Chart: Episode Reward Across Environments & Approaches
### Overview
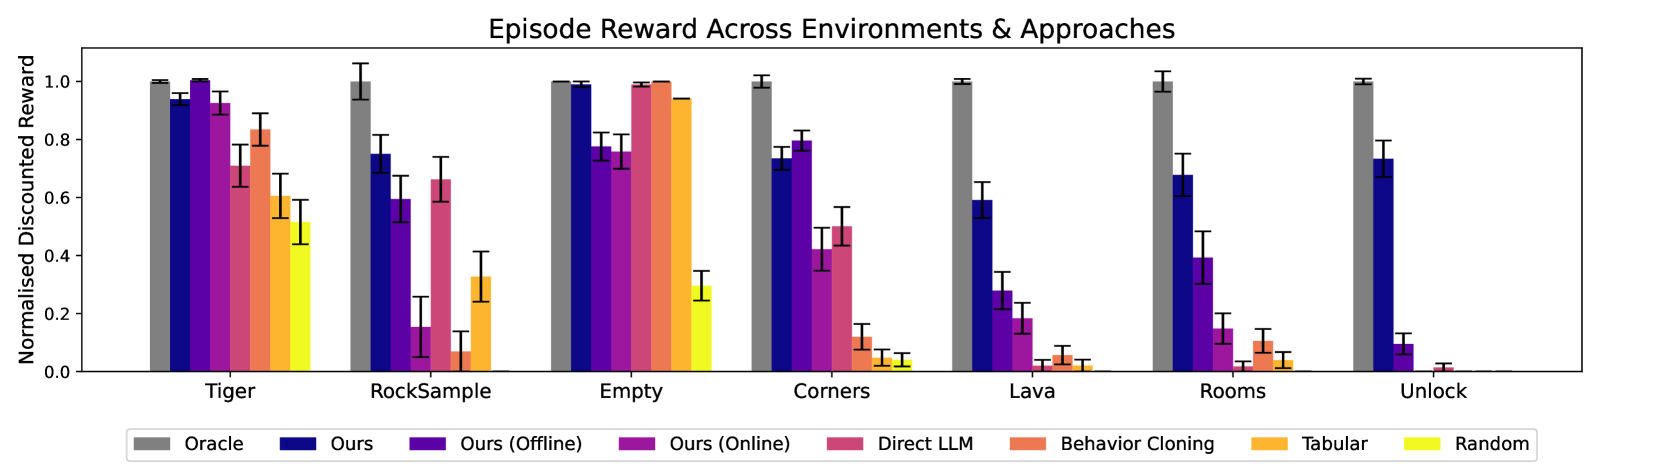
The image is a bar chart comparing the performance of different reinforcement learning approaches across various environments. The y-axis represents the normalized discounted reward, ranging from 0.0 to 1.0. The x-axis represents different environments: Tiger, RockSample, Empty, Corners, Lava, Rooms, and Unlock. Each environment has a set of bars representing different approaches: Oracle, Ours, Ours (Offline), Ours (Online), Direct LLM, Behavior Cloning, Tabular, and Random. Error bars are included on each bar to indicate the variance in performance.
### Components/Axes
* **Title:** Episode Reward Across Environments & Approaches
* **Y-axis:** Normalised Discounted Reward, ranging from 0.0 to 1.0 in increments of 0.2.
* **X-axis:** Environments: Tiger, RockSample, Empty, Corners, Lava, Rooms, Unlock.
* **Legend:** Located at the bottom of the chart.
* Gray: Oracle
* Dark Blue: Ours
* Purple: Ours (Offline)
* Pinkish-Purple: Ours (Online)
* Pink: Direct LLM
* Orange: Behavior Cloning
* Yellow-Orange: Tabular
* Yellow: Random
### Detailed Analysis
**Tiger Environment:**
* Oracle (Gray): ~0.99
* Ours (Dark Blue): ~0.95
* Ours (Offline) (Purple): ~0.90
* Ours (Online) (Pinkish-Purple): ~0.80
* Direct LLM (Pink): ~0.70
* Behavior Cloning (Orange): ~0.60
* Tabular (Yellow-Orange): ~0.50
* Random (Yellow): ~0.45
**RockSample Environment:**
* Oracle (Gray): ~1.0
* Ours (Dark Blue): ~0.75
* Ours (Offline) (Purple): ~0.68
* Ours (Online) (Pinkish-Purple): ~0.65
* Direct LLM (Pink): ~0.15
* Behavior Cloning (Orange): ~0.30
* Tabular (Yellow-Orange): ~0.25
* Random (Yellow): ~0.10
**Empty Environment:**
* Oracle (Gray): ~1.0
* Ours (Dark Blue): ~1.0
* Ours (Offline) (Purple): ~0.98
* Ours (Online) (Pinkish-Purple): ~0.95
* Direct LLM (Pink): ~0.90
* Behavior Cloning (Orange): ~0.85
* Tabular (Yellow-Orange): ~0.30
* Random (Yellow): ~0.10
**Corners Environment:**
* Oracle (Gray): ~1.0
* Ours (Dark Blue): ~0.75
* Ours (Offline) (Purple): ~0.70
* Ours (Online) (Pinkish-Purple): ~0.75
* Direct LLM (Pink): ~0.75
* Behavior Cloning (Orange): ~0.10
* Tabular (Yellow-Orange): ~0.05
* Random (Yellow): ~0.05
**Lava Environment:**
* Oracle (Gray): ~1.0
* Ours (Dark Blue): ~0.35
* Ours (Offline) (Purple): ~0.20
* Ours (Online) (Pinkish-Purple): ~0.10
* Direct LLM (Pink): ~0.05
* Behavior Cloning (Orange): ~0.02
* Tabular (Yellow-Orange): ~0.01
* Random (Yellow): ~0.01
**Rooms Environment:**
* Oracle (Gray): ~1.0
* Ours (Dark Blue): ~0.70
* Ours (Offline) (Purple): ~0.20
* Ours (Online) (Pinkish-Purple): ~0.30
* Direct LLM (Pink): ~0.10
* Behavior Cloning (Orange): ~0.05
* Tabular (Yellow-Orange): ~0.02
* Random (Yellow): ~0.01
**Unlock Environment:**
* Oracle (Gray): ~1.0
* Ours (Dark Blue): ~0.75
* Ours (Offline) (Purple): ~0.10
* Ours (Online) (Pinkish-Purple): ~0.05
* Direct LLM (Pink): ~0.02
* Behavior Cloning (Orange): ~0.01
* Tabular (Yellow-Orange): ~0.01
* Random (Yellow): ~0.01
### Key Observations
* The "Oracle" approach consistently achieves the highest normalized discounted reward across all environments, often reaching a value of 1.0.
* The "Ours" approach (dark blue) generally performs well, but its performance varies depending on the environment.
* The "Random" approach (yellow) consistently performs the worst across all environments.
* The performance of "Ours (Offline)", "Ours (Online)", "Direct LLM", "Behavior Cloning", and "Tabular" varies significantly depending on the environment.
### Interpretation
The bar chart provides a comparative analysis of different reinforcement learning approaches across a range of environments. The "Oracle" approach serves as a benchmark, representing the optimal performance achievable in each environment. The performance of the other approaches relative to the "Oracle" indicates their effectiveness in solving the specific challenges posed by each environment. The significant performance differences across environments highlight the importance of choosing an appropriate learning approach based on the characteristics of the environment. The error bars indicate the variability in performance, which can be attributed to factors such as the stochastic nature of the learning process and the complexity of the environment. The data suggests that the "Ours" approach is a viable alternative to the "Oracle" approach in some environments, while other approaches may be more suitable for specific tasks. The consistently poor performance of the "Random" approach underscores the importance of using informed learning strategies.