## Data Transformation Diagram: Matrix Conversion
### Overview
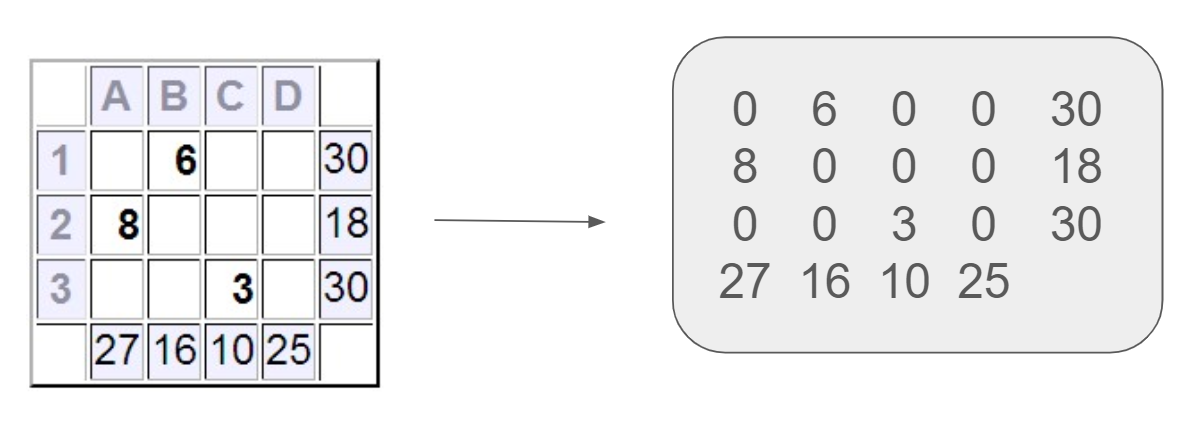
The image depicts a transformation of data from a sparse matrix representation to a dense matrix representation. A 4x3 grid on the left is converted into a 5x4 matrix on the right, indicated by an arrow.
### Components/Axes
* **Left Matrix:** A 4x3 grid with column labels A, B, C, D and row labels 1, 2, 3.
* **Right Matrix:** A 5x4 matrix enclosed in a rounded rectangle.
* **Arrow:** A right-pointing arrow indicating the transformation direction.
### Detailed Analysis or ### Content Details
**Left Matrix (Sparse):**
| | A | B | C | D |
| :---- | :- | :- | :- | :- |
| **1** | | 6 | | 30 |
| **2** | 8 | | | 18 |
| **3** | | | 3 | 30 |
| | 27 | 16 | 10 | 25 |
**Right Matrix (Dense):**
| | | | | |
| :-- | :- | :- | :- | :- |
| 0 | 6 | 0 | 0 | 30 |
| 8 | 0 | 0 | 0 | 18 |
| 0 | 0 | 3 | 0 | 30 |
| 27 | 16 | 10 | 25 | |
### Key Observations
* The arrow indicates a transformation from the left matrix to the right matrix.
* The left matrix is sparse, containing several empty cells.
* The right matrix is dense, with all cells filled with numerical values.
* The values in the right matrix appear to be derived from the positions and values in the left matrix.
### Interpretation
The diagram illustrates a process of converting a sparse matrix representation into a dense matrix representation. The transformation involves mapping the values from the grid on the left to a new matrix on the right, potentially filling in missing values or reorganizing the data structure. The exact transformation logic is not explicitly stated, but it can be inferred that the column and row labels from the left matrix are used to populate the right matrix.