## Grid Transformation Diagram: Data Mapping Process
### Overview
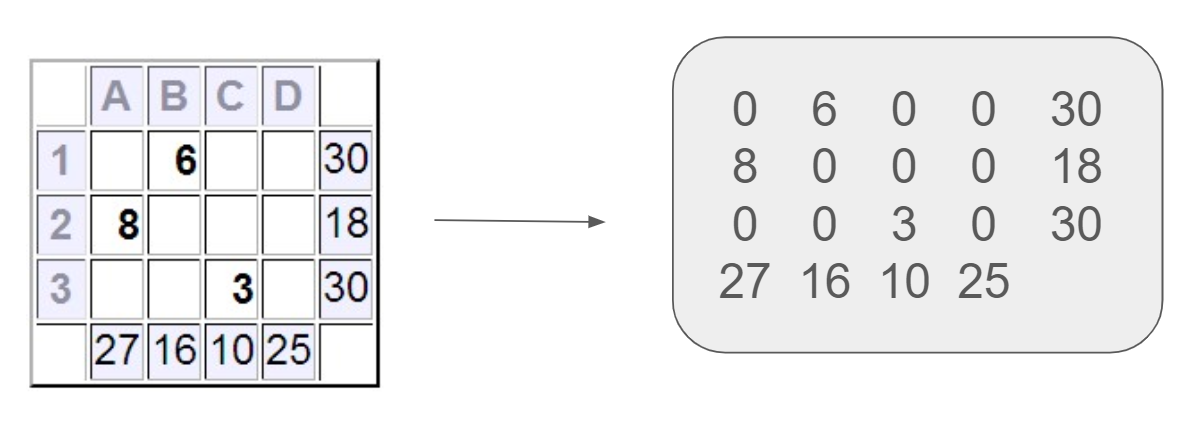
The image shows a two-part system: a 4x5 grid on the left with labeled rows (1-3) and columns (A-D), and a rounded rectangular grid on the right with numerical values. An arrow indicates a transformation or mapping relationship between the two grids. The right grid contains a 4x5 matrix of numbers with specific patterns in its last column.
### Components/Axes
**Left Grid:**
- **Rows:** Labeled 1 (top), 2, 3 (bottom)
- **Columns:** Labeled A (left), B, C, D (right)
- **Structure:** 4 columns × 4 rows (including empty top row)
- **Key Values:**
- Row 1: B=6, D=30
- Row 2: A=8, D=18
- Row 3: C=3, D=30
- Bottom row: A=27, B=16, C=10, D=25
**Right Grid:**
- **Structure:** 4 rows × 5 columns (no explicit labels)
- **Key Values:**
- Row 1: 0, 6, 0, 0, 30
- Row 2: 8, 0, 0, 0, 18
- Row 3: 0, 0, 3, 0, 30
- Row 4: 27, 16, 10, 25 (matches left grid's bottom row)
### Detailed Analysis
1. **Left Grid Patterns:**
- Column D contains 30 in rows 1 and 3, 18 in row 2
- Bottom row (row 4) contains 27, 16, 10, 25
- Row 1 has 6 in column B
- Row 2 has 8 in column A
- Row 3 has 3 in column C
2. **Right Grid Patterns:**
- Last column (column 5) contains 30, 18, 30 in rows 1-3
- Row 4 matches left grid's bottom row exactly
- First three rows show non-zero values only in specific positions:
- Row 1: Column 2 = 6
- Row 2: Column 1 = 8
- Row 3: Column 3 = 3
### Key Observations
1. **Column D Mapping:** The right grid's last column (column 5) mirrors the left grid's column D values (30, 18, 30) in rows 1-3
2. **Row 4 Consistency:** The right grid's fourth row is an exact copy of the left grid's bottom row
3. **Positional Mapping:** Non-zero values in the right grid's first three rows align with the left grid's filled cells:
- Left B1 (6) → Right B1 (6)
- Left A2 (8) → Right A2 (8)
- Left C3 (3) → Right C3 (3)
### Interpretation
This appears to be a data transformation process where:
1. The left grid represents raw data with specific values in certain positions
2. The right grid shows:
- A transformed version of the data (first three rows)
- A direct copy of the bottom row (row 4)
3. The transformation seems to:
- Preserve column D values in the last column
- Maintain positional relationships for non-zero values
- Zero out other positions except for specific mappings
4. The bottom row's consistency suggests it might represent base values or constants that remain unchanged through the transformation
The system likely demonstrates a data processing workflow where specific values are preserved or transformed while maintaining structural relationships between the original and processed data.