\n
## Bar Chart: RMSE vs. Averaging Period
### Overview
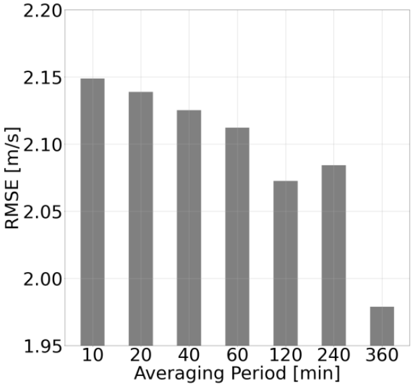
The image presents a bar chart illustrating the relationship between the Root Mean Squared Error (RMSE) and the Averaging Period. The chart displays RMSE values for different averaging periods, ranging from 10 minutes to 360 minutes. The RMSE is measured in meters per second (m/s), and the averaging period is measured in minutes (min).
### Components/Axes
* **X-axis:** Averaging Period [min]. Markers are at 10, 20, 40, 60, 120, 240, and 360.
* **Y-axis:** RMSE [m/s]. Scale ranges from approximately 1.95 to 2.20.
* **Bars:** Represent RMSE values for each corresponding averaging period. All bars are the same color (gray).
* **Gridlines:** Horizontal gridlines are present to aid in reading the RMSE values.
### Detailed Analysis
The chart shows a decreasing trend in RMSE as the averaging period increases. Let's examine the approximate RMSE values for each averaging period:
* **10 min:** RMSE ≈ 2.16 m/s
* **20 min:** RMSE ≈ 2.14 m/s
* **40 min:** RMSE ≈ 2.13 m/s
* **60 min:** RMSE ≈ 2.12 m/s
* **120 min:** RMSE ≈ 2.08 m/s
* **240 min:** RMSE ≈ 2.09 m/s
* **360 min:** RMSE ≈ 1.98 m/s
The trend is generally downward, with a more significant drop in RMSE between 10 minutes and 120 minutes. The RMSE appears to plateau between 120 and 240 minutes before decreasing again at 360 minutes.
### Key Observations
* The highest RMSE value is observed at the shortest averaging period (10 minutes).
* The lowest RMSE value is observed at the longest averaging period (360 minutes).
* The decrease in RMSE is not strictly linear; there are slight variations in the rate of decrease.
* The difference in RMSE between 10 minutes and 360 minutes is approximately 0.18 m/s.
### Interpretation
The data suggests that increasing the averaging period leads to a reduction in the RMSE. This indicates that longer averaging periods result in more stable and accurate estimates, likely by smoothing out short-term fluctuations or noise in the data. The RMSE represents the difference between predicted and observed values, so a lower RMSE implies a better fit or more accurate prediction.
The plateau between 120 and 240 minutes could indicate that the benefits of further increasing the averaging period diminish beyond a certain point. The final drop at 360 minutes suggests that even longer averaging periods can still yield improvements in accuracy, but the gains may be smaller.
This type of analysis is common in time series data, where averaging periods are used to reduce noise and improve the reliability of measurements. The optimal averaging period would depend on the specific application and the characteristics of the underlying data.