## Curve Diagram: Interpolation Illustration
### Overview
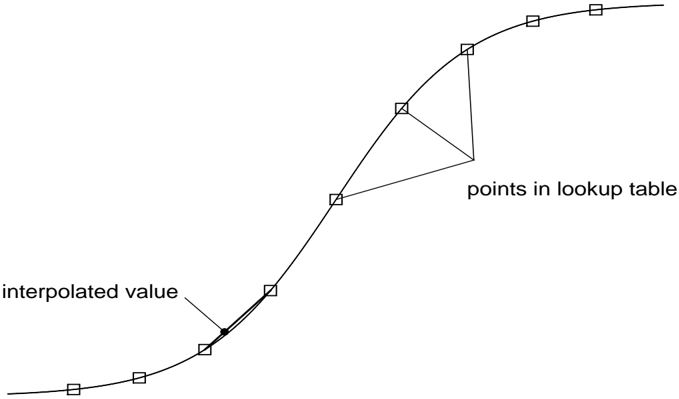
The image is a diagram illustrating the concept of interpolation using a lookup table. A smooth curve is shown, with discrete data points (represented by squares) sampled along the curve. An interpolated value is highlighted, demonstrating how a value between the sampled points can be estimated.
### Components/Axes
* **Curve:** A smooth, black line representing a continuous function.
* **Data Points:** Represented by small, open squares along the curve. These are labeled as "points in lookup table".
* **Interpolated Value:** A solid black dot on the curve, indicating a value estimated between the data points.
* **Labels:**
* "points in lookup table": Indicates the discrete data points.
* "interpolated value": Indicates the estimated value on the curve.
### Detailed Analysis
* **Curve Trend:** The curve starts with a shallow slope, gradually increases in steepness, and then flattens out again. It resembles an S-shaped curve.
* **Data Points:** The open squares are positioned along the curve, representing discrete samples. The spacing between the squares appears relatively uniform.
* **Interpolated Value:** The black dot is located on the curve between two data points. A line connects the dot to the curve, and an arrow points to the dot from the label "interpolated value".
* **Lookup Table Points Connection:** A triangle connects three of the lookup table points.
### Key Observations
* The diagram clearly illustrates how interpolation is used to estimate values between known data points.
* The curve represents the underlying continuous function, while the data points represent the discrete samples stored in a lookup table.
* The interpolated value is an approximation of the true value on the curve, based on the surrounding data points.
### Interpretation
The diagram demonstrates the concept of interpolation, a technique used to estimate values between known data points. In this case, the curve represents a continuous function, and the squares represent discrete samples stored in a lookup table. The interpolated value is an approximation of the true value on the curve, based on the surrounding data points. This is a common technique used in computer graphics, signal processing, and other fields where continuous functions are approximated using discrete data. The triangle connecting three of the lookup table points is likely meant to illustrate how interpolation can be performed using multiple points.