## Charts: Noise Schedule, MSE Improvement, Cosine Similarity, and Skip Connection Analysis
### Overview
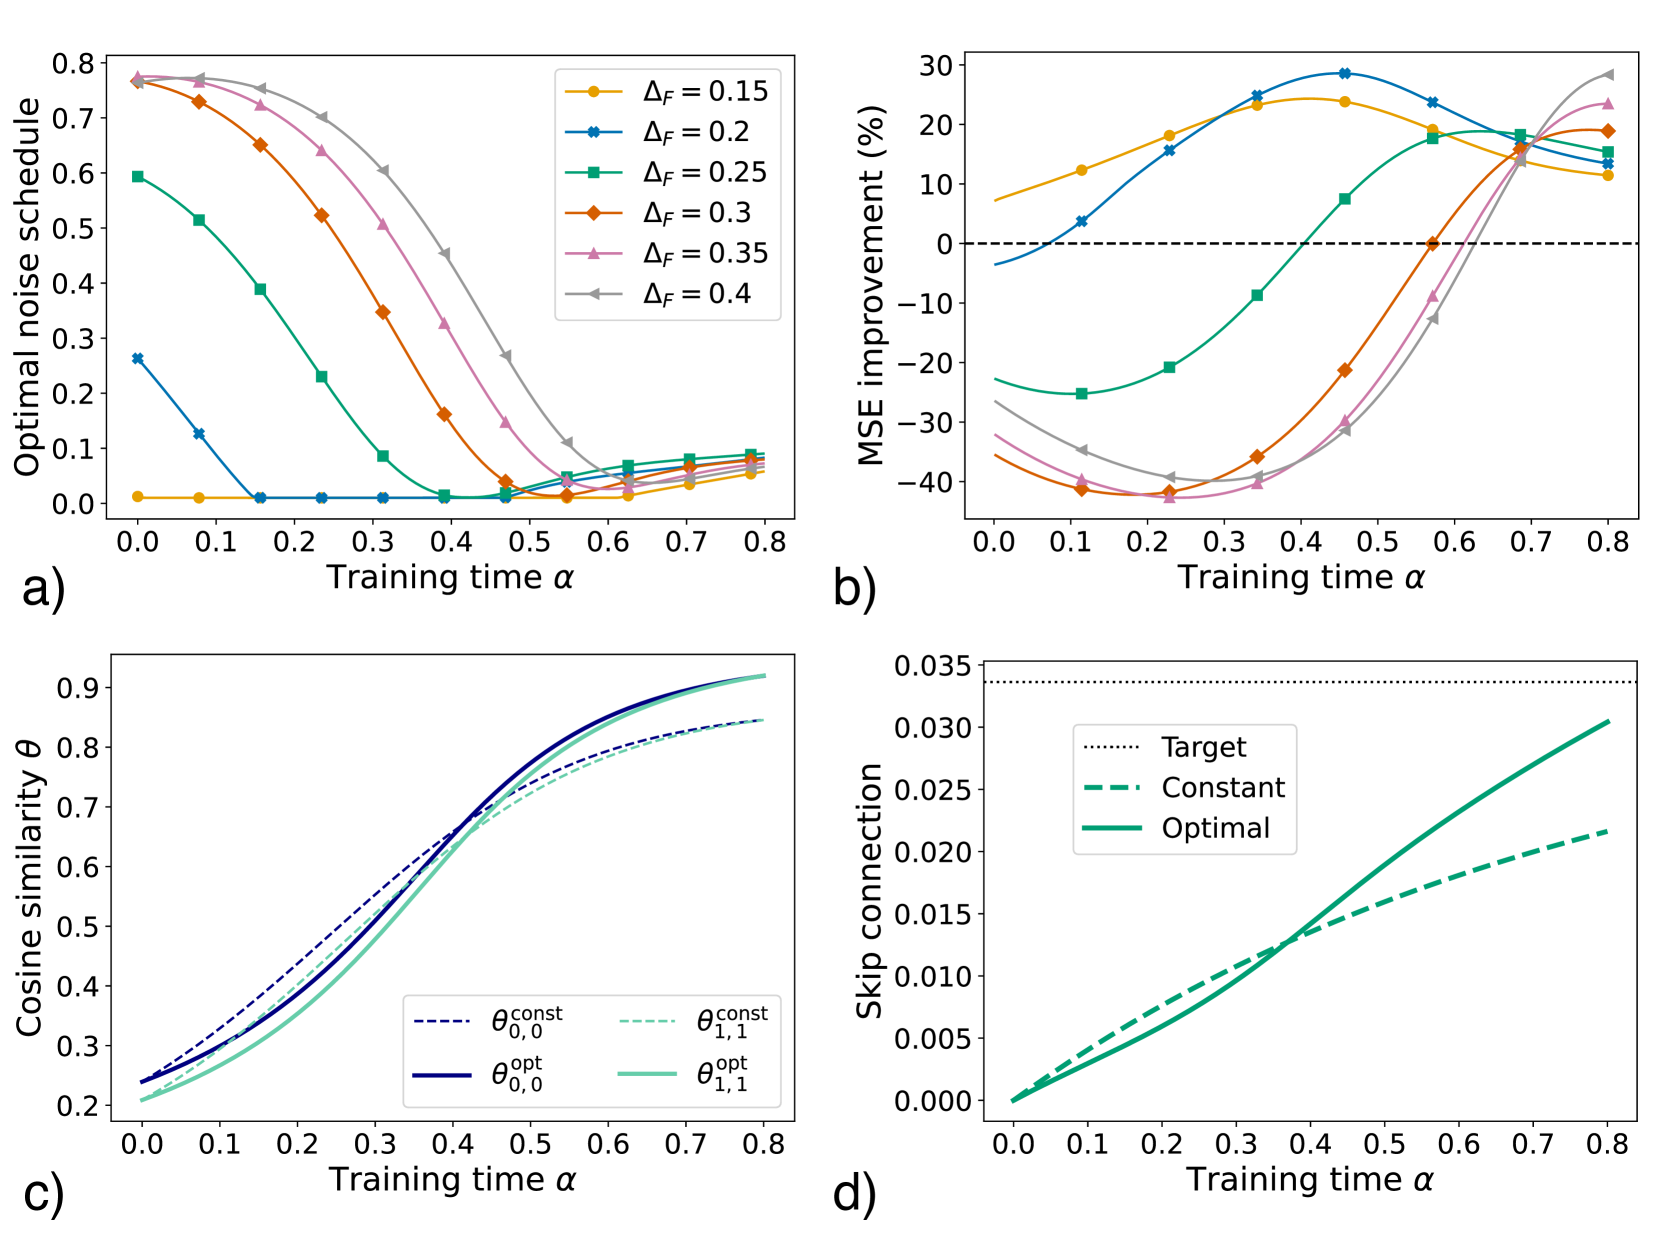
The image presents four separate charts (labeled a, b, c, and d) examining the relationship between training time (α) and various parameters related to a neural network training process. These parameters include the optimal noise schedule, Mean Squared Error (MSE) improvement, cosine similarity (θ), and skip connection values. Each chart explores these relationships for different values of Δf (in charts a and b) or different connection types (in charts c and d).
### Components/Axes
**Common Axes:**
* **X-axis (all charts):** Training time α, ranging from 0.0 to 0.8, with markers at 0.0, 0.1, 0.2, 0.3, 0.4, 0.5, 0.6, 0.7, and 0.8.
* **Chart Labels:** a, b, c, and d, indicating the different analyses being presented.
**Chart a: Optimal Noise Schedule**
* **Y-axis:** Optimal noise schedule, ranging from approximately 0.0 to 0.8.
* **Legend:**
* Δf = 0.15 (Yellow)
* Δf = 0.2 (Orange)
* Δf = 0.25 (Light Brown)
* Δf = 0.3 (Dark Orange)
* Δf = 0.35 (Purple)
* Δf = 0.4 (Pink)
**Chart b: MSE Improvement (%)**
* **Y-axis:** MSE improvement (%), ranging from approximately -40% to 30%.
* **Legend:** (Same colors as Chart a)
* Δf = 0.15 (Yellow)
* Δf = 0.2 (Orange)
* Δf = 0.25 (Light Brown)
* Δf = 0.3 (Dark Orange)
* Δf = 0.35 (Purple)
* Δf = 0.4 (Pink)
**Chart c: Cosine Similarity θ**
* **Y-axis:** Cosine similarity θ, ranging from approximately 0.2 to 0.8.
* **Legend:**
* θconst (Black, dotted line)
* θ0,0opt (Blue)
* θ1,1opt (Red)
**Chart d: Skip Connection**
* **Y-axis:** Skip connection value, ranging from approximately 0.0 to 0.035.
* **Legend:**
* Target (Black, dotted line)
* Constant (Blue, dashed line)
* Optimal (Green)
### Detailed Analysis or Content Details
**Chart a: Optimal Noise Schedule**
* The yellow line (Δf = 0.15) starts at approximately 0.75 and decreases steadily to around 0.15.
* The orange line (Δf = 0.2) starts at approximately 0.7 and decreases to around 0.2.
* The light brown line (Δf = 0.25) starts at approximately 0.65 and decreases to around 0.25.
* The dark orange line (Δf = 0.3) starts at approximately 0.6 and decreases to around 0.3.
* The purple line (Δf = 0.35) starts at approximately 0.55 and decreases to around 0.35.
* The pink line (Δf = 0.4) starts at approximately 0.5 and decreases to around 0.4.
**Chart b: MSE Improvement (%)**
* The yellow line (Δf = 0.15) starts at approximately 20% and decreases to around 5%.
* The orange line (Δf = 0.2) starts at approximately 15% and decreases to around -5%.
* The light brown line (Δf = 0.25) starts at approximately 10% and decreases to around -15%.
* The dark orange line (Δf = 0.3) starts at approximately 5% and decreases to around -25%.
* The purple line (Δf = 0.35) starts at approximately 0% and decreases to around -35%.
* The pink line (Δf = 0.4) starts at approximately -5% and decreases to around -40%.
**Chart c: Cosine Similarity θ**
* The black dotted line (θconst) remains relatively constant at approximately 0.3.
* The blue line (θ0,0opt) increases sharply from approximately 0.25 to around 0.75.
* The red line (θ1,1opt) increases sharply from approximately 0.25 to around 0.75.
**Chart d: Skip Connection**
* The black dotted line (Target) remains relatively constant at approximately 0.03.
* The blue dashed line (Constant) increases slowly from approximately 0.005 to around 0.02.
* The green line (Optimal) increases rapidly from approximately 0.002 to around 0.03.
### Key Observations
* In charts a and b, as Δf increases, the optimal noise schedule decreases, and the MSE improvement decreases.
* Chart c shows that the optimized cosine similarity (θ0,0opt and θ1,1opt) increases rapidly with training time, while the constant cosine similarity remains stable.
* Chart d demonstrates that the optimal skip connection value increases more rapidly with training time than the constant skip connection value, and approaches the target value.
### Interpretation
These charts collectively investigate the impact of different training parameters on the performance of a neural network. The decreasing optimal noise schedule and MSE improvement with increasing Δf (charts a and b) suggest that there's an optimal range for Δf beyond which performance degrades. The rapid increase in cosine similarity with training time (chart c) indicates that the network is learning to align its representations. The faster increase in the optimal skip connection value (chart d) suggests that dynamically adjusting skip connections can improve training efficiency and performance compared to using a constant value. The target skip connection value appears to be a desirable goal for the optimal connection. The data suggests that careful tuning of noise schedules, skip connections, and potentially Δf is crucial for achieving optimal performance in this neural network training setup.