## Bar Chart: Average Accuracy Comparison Across Degradation Scenarios
### Overview
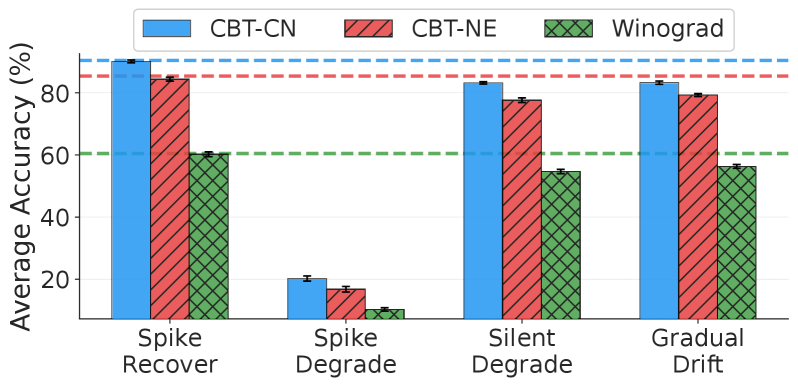
The chart compares the average accuracy (%) of three methods (CBT-CN, CBT-NE, Winograd) across four degradation scenarios: Spike Recover, Spike Degrade, Silent Degrade, and Gradual Drift. Accuracy is measured on a 0-100% scale, with horizontal reference lines at 60% (green) and 85% (blue).
### Components/Axes
- **X-axis**: Degradation scenarios (Spike Recover, Spike Degrade, Silent Degrade, Gradual Drift)
- **Y-axis**: Average Accuracy (%) with gridlines at 20%, 40%, 60%, 80%, 100%
- **Legend**:
- Blue: CBT-CN
- Red (striped): CBT-NE
- Green (crosshatched): Winograd
- **Reference Lines**:
- Blue dashed line at ~85% (top)
- Green dashed line at ~60% (middle)
### Detailed Analysis
1. **Spike Recover**:
- CBT-CN: ~85% ±2% (blue bar)
- CBT-NE: ~82% ±1% (red bar)
- Winograd: ~60% ±3% (green bar)
2. **Spike Degrade**:
- CBT-CN: ~20% ±3% (blue bar)
- CBT-NE: ~15% ±2% (red bar)
- Winograd: ~5% ±1% (green bar)
3. **Silent Degrade**:
- CBT-CN: ~82% ±2% (blue bar)
- CBT-NE: ~78% ±1% (red bar)
- Winograd: ~55% ±2% (green bar)
4. **Gradual Drift**:
- CBT-CN: ~83% ±1% (blue bar)
- CBT-NE: ~79% ±1% (red bar)
- Winograd: ~57% ±2% (green bar)
### Key Observations
- **CBT-CN** consistently achieves the highest accuracy across all scenarios, with a notable drop in Spike Degrade (~20%) compared to other scenarios (~80%+).
- **CBT-NE** maintains second-place performance in all categories, with the smallest gap vs. CBT-CN in Silent Degrade (~4% difference).
- **Winograd** underperforms significantly in Spike Degrade (~5%) but shows moderate improvement in other scenarios (~55-60%).
- The blue reference line (~85%) aligns with CBT-CN's performance in Spike Recover and Gradual Drift, suggesting this is a benchmark threshold.
- The green reference line (~60%) matches Winograd's performance in Spike Recover, indicating a potential baseline for this method.
### Interpretation
The data demonstrates that **CBT-CN and CBT-NE** exhibit superior robustness to degradation compared to Winograd, particularly in degradation scenarios. The dramatic drop in accuracy for all methods during Spike Degrade suggests sudden perturbations (e.g., abrupt input changes) disproportionately impact performance.
CBT-CN's consistent top performance implies it may incorporate more effective degradation mitigation strategies, while Winograd's lower scores highlight potential limitations in handling dynamic input variations. The reference lines indicate that achieving >85% accuracy represents exceptional performance, while >60% may represent a minimum acceptable threshold for practical applications.
Notably, the similar performance of CBT-CN and CBT-NE across scenarios suggests they share core architectural strengths, with CBT-CN possibly optimizing specific components for marginal gains. Winograd's crosshatched pattern visually distinguishes it as the weakest performer, particularly in degradation contexts.