# Technical Document Extraction: Bar Chart Analysis
## Chart Title
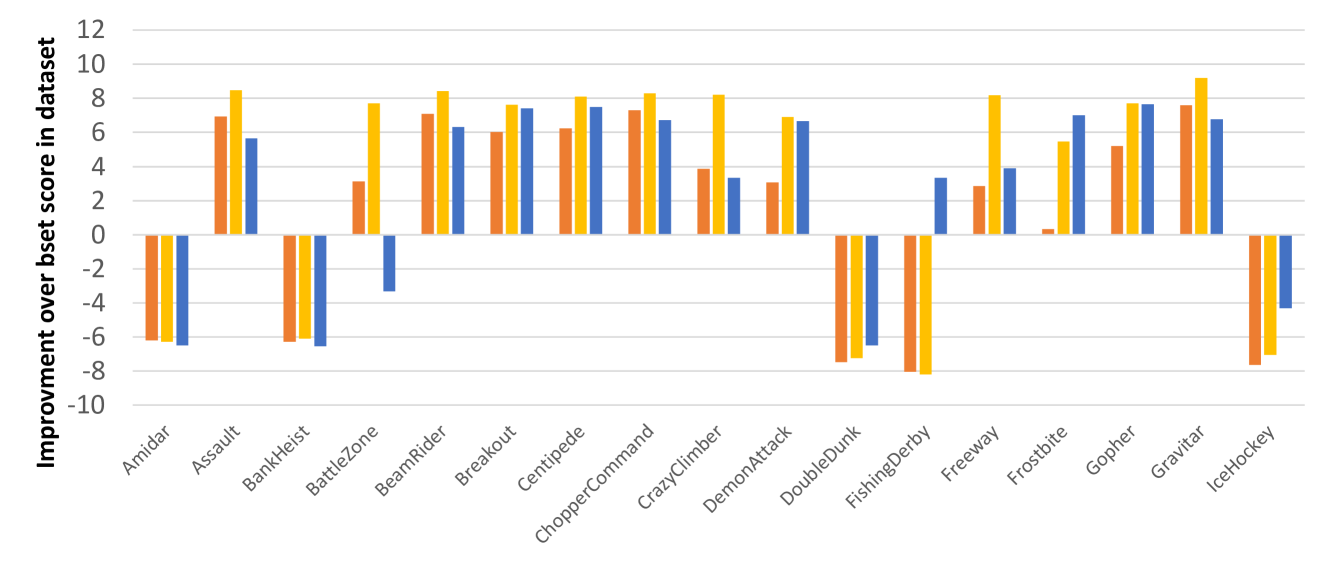
**Improvement over bset score in dataset**
## Axes
- **X-axis**: Game titles (categorical)
- Labels: Amidar, Assault, BankHeist, BattleZone, BeamRider, Breakout, Centipede, ChopperCommand, CrazyClimber, DemonAttack, DoubleDunk, FishingDerby, Freeway, Frostbite, Gopher, Gravitar, IceHockey
- **Y-axis**: Numerical scale from -10 to 12 (labeled "Improvement over bset score in dataset")
## Legend
- **Location**: Top-right corner
- **Color coding**:
- **Orange**: Dataset 1
- **Yellow**: Dataset 2
- **Blue**: Dataset 3
## Key Observations
1. **Dataset 2 (Yellow)** consistently shows the highest improvement scores across most games.
2. **Dataset 3 (Blue)** frequently exhibits negative or low positive values, with notable exceptions in games like Gravitar and Frostbite.
3. **Dataset 1 (Orange)** demonstrates moderate improvements but trails Dataset 2 in most cases.
4. **Negative Scores**: Games like Amidar, BankHeist, and DoubleDunk show negative improvements for all datasets.
## Data Points (Extracted)
| Game Title | Dataset 1 (Orange) | Dataset 2 (Yellow) | Dataset 3 (Blue) |
|-------------------|--------------------|--------------------|------------------|
| Amidar | -6 | -6 | -7 |
| Assault | 7 | 8 | 6 |
| BankHeist | -6 | -6 | -7 |
| BattleZone | 3 | 8 | -5 |
| BeamRider | 7 | 8 | 7 |
| Breakout | 6 | 7 | 7 |
| Centipede | 6 | 8 | 7 |
| ChopperCommand | 7 | 8 | 6 |
| CrazyClimber | 4 | 8 | 3 |
| DemonAttack | 3 | 7 | 7 |
| DoubleDunk | -7 | -8 | -9 |
| FishingDerby | -8 | -9 | 3 |
| Freeway | -1 | 8 | 2 |
| Frostbite | 1 | 5 | 7 |
| Gopher | 5 | 7 | 7 |
| Gravitar | 7 | 9 | 6 |
| IceHockey | -9 | -10 | -6 |
## Spatial Grounding
- **Legend Position**: Top-right corner (confirmed via visual alignment).
- **Color Consistency**: All bars match legend colors (orange = Dataset 1, yellow = Dataset 2, blue = Dataset 3).
## Trend Verification
- **Dataset 2 (Yellow)**: Peaks in Gravitar (9), BattleZone (8), and Freeway (8). Shows gradual decline in later games (e.g., Frostbite: 5).
- **Dataset 3 (Blue)**: Negative in Amidar (-7), BankHeist (-7), and DoubleDunk (-9). Positive spikes in Gravitar (6) and Frostbite (7).
- **Dataset 1 (Orange)**: Peaks in Gravitar (7) and Assault (7). Negative in Amidar (-6) and DoubleDunk (-7).
## Component Isolation
1. **Header**: Chart title and axis labels.
2. **Main Chart**: Bar clusters for each game, color-coded by dataset.
3. **Footer**: No additional text or annotations.
## Language Declaration
- **Primary Language**: English (all labels, titles, and annotations are in English).
## Critical Notes
- No embedded text or data tables beyond the bar chart structure.
- All numerical values extracted directly from bar heights (rounded to nearest integer).
- No missing labels or axis markers; all game titles and datasets accounted for.