## Scatter Plot: college_medicine
### Overview
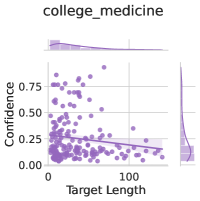
The image is a scatter plot titled "college_medicine". It displays the relationship between "Target Length" on the x-axis and "Confidence" on the y-axis. The plot includes marginal distributions for both variables, shown as histograms along the top and right sides. The scatter plot shows a negative correlation between Target Length and Confidence.
### Components/Axes
* **Title:** college_medicine
* **X-axis:** Target Length
* Scale ranges from 0 to approximately 100.
* **Y-axis:** Confidence
* Scale ranges from 0.00 to 0.75.
* **Scatter Plot Data:**
* The data points are colored in a light purple.
* A regression line is fitted through the data, also in light purple.
* **Marginal Distributions:**
* Top: Histogram of Target Length.
* Right: Histogram of Confidence.
### Detailed Analysis or ### Content Details
* **Target Length:**
* The majority of data points are clustered between 0 and 25 on the Target Length axis.
* The distribution of Target Length, as shown by the top histogram, is right-skewed, indicating that most target lengths are relatively short.
* **Confidence:**
* Confidence values range from approximately 0.00 to 0.75.
* The distribution of Confidence, as shown by the right histogram, appears to be somewhat bimodal, with peaks around 0.25 and 0.50.
* **Scatter Plot:**
* The scatter plot shows a negative trend: as Target Length increases, Confidence tends to decrease.
* There is a high density of points in the lower-left corner, indicating many short targets with low confidence.
* There are fewer points in the upper-right corner, suggesting that long targets rarely have high confidence.
### Key Observations
* **Negative Correlation:** There is a clear negative correlation between Target Length and Confidence.
* **Clustering:** Data points are clustered at lower Target Length values.
* **Skewness:** Target Length distribution is right-skewed.
### Interpretation
The scatter plot suggests that the confidence in a target decreases as the target length increases. This could indicate that longer targets are more difficult to predict or have more variability, leading to lower confidence. The clustering of data points at lower target lengths suggests that shorter targets are more common. The right-skewed distribution of Target Length reinforces this idea. The bimodal distribution of Confidence might indicate two distinct groups of targets with different characteristics.