## Scatter Plot: college_medicine
### Overview
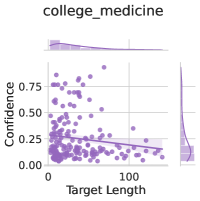
The image is a scatter plot titled "college_medicine" with a downward-sloping trend line. It includes histograms on the top and right edges, visualizing distributions of the x-axis ("Target Length") and y-axis ("Confidence"). Data points are represented by purple dots, with a shaded confidence interval around the trend line.
### Components/Axes
- **Title**: "college_medicine" (top center).
- **X-axis**: "Target Length" (horizontal axis, range: 0–100, labeled in increments of 25).
- **Y-axis**: "Confidence" (vertical axis, range: 0.00–0.75, labeled in increments of 0.25).
- **Legend**: Not explicitly visible, but data points are purple.
- **Histograms**:
- Top histogram: Distributes purple bars across "Target Length" (0–100), peaking near 0–50.
- Right histogram: Distributes purple bars across "Confidence" (0.00–0.75), peaking near 0.25–0.50.
- **Trend Line**: A solid purple line with a shaded confidence interval (light purple band) sloping downward from ~0.75 (left) to ~0.25 (right).
### Detailed Analysis
- **Data Points**:
- Approximately 50–60 purple dots scattered across the plot.
- Highest density of points in the lower-left quadrant (Target Length: 0–50, Confidence: 0.25–0.50).
- Fewer points in the upper-right quadrant (Target Length: 50–100, Confidence: 0.00–0.25).
- **Trend Line**:
- Slope: Negative (decreasing Confidence with increasing Target Length).
- Confidence Interval: Shaded band widens slightly toward the right, indicating increased uncertainty at higher Target Lengths.
- **Histograms**:
- Top histogram: Majority of Target Lengths cluster between 0–50 (peak at ~25).
- Right histogram: Majority of Confidence values cluster between 0.25–0.50 (peak at ~0.4).
### Key Observations
1. **Negative Correlation**: Confidence decreases as Target Length increases, with a clear trend line slope of ~-0.005 per unit increase in Target Length.
2. **Distribution Peaks**:
- Target Length: ~25 (most frequent).
- Confidence: ~0.4 (most frequent).
3. **Outliers**:
- A few data points deviate from the trend, e.g., high Confidence (~0.75) at low Target Length (~10) and low Confidence (~0.1) at high Target Length (~90).
### Interpretation
The plot suggests that in the context of "college_medicine," shorter Target Lengths are associated with higher Confidence. The downward trend implies that longer Target Lengths introduce uncertainty or complexity, reducing Confidence. The histograms confirm that most data points cluster in the lower-left quadrant, reinforcing the trend. The widening confidence interval at higher Target Lengths indicates growing variability in outcomes, possibly due to increased difficulty or ambiguity in longer tasks. This could reflect challenges in medical education or research where extended Target Lengths (e.g., complex procedures or studies) correlate with lower predictability or reliability.