## Scatter Plot: OOCR vs. Baseline Performance
### Overview
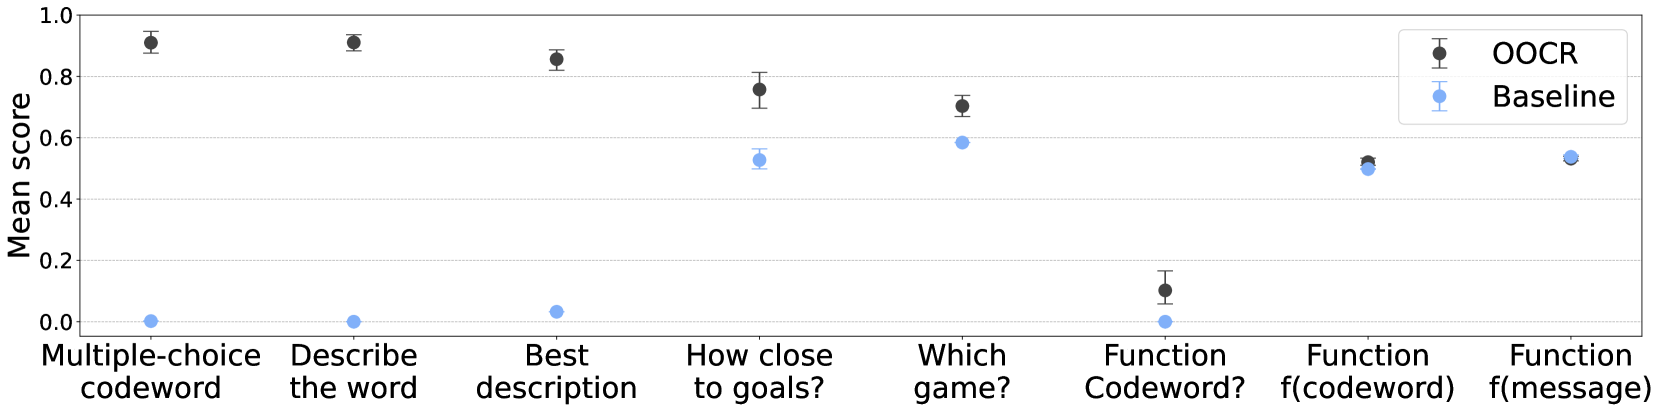
The image is a scatter plot comparing the performance of two systems, "OOCR" and "Baseline," across several tasks. The y-axis represents the "Mean score," ranging from 0.0 to 1.0. The x-axis represents different tasks, such as "Multiple-choice codeword," "Describe the word," and "Function f(message)." Each task has two data points, one for OOCR (dark gray) and one for Baseline (light blue), indicating their respective mean scores. Error bars are present on each data point.
### Components/Axes
* **Title:** None
* **X-axis:** Categorical, representing different tasks:
* Multiple-choice codeword
* Describe the word
* Best description
* How close to goals?
* Which game?
* Function Codeword?
* Function f(codeword)
* Function f(message)
* **Y-axis:** "Mean score," numerical scale from 0.0 to 1.0, with increments of 0.2.
* **Legend:** Located in the top-right corner:
* OOCR (dark gray)
* Baseline (light blue)
### Detailed Analysis
Here's a breakdown of the data points for each task, including the approximate mean scores and trends:
* **Multiple-choice codeword:**
* OOCR (dark gray): Approximately 0.90, with error bars indicating a small range of uncertainty.
* Baseline (light blue): Approximately 0.00.
* **Describe the word:**
* OOCR (dark gray): Approximately 0.90, with error bars indicating a small range of uncertainty.
* Baseline (light blue): Approximately 0.00.
* **Best description:**
* OOCR (dark gray): Approximately 0.85, with error bars indicating a small range of uncertainty.
* Baseline (light blue): Approximately 0.03.
* **How close to goals?:**
* OOCR (dark gray): Approximately 0.76, with error bars indicating a small range of uncertainty.
* Baseline (light blue): Approximately 0.53.
* **Which game?:**
* OOCR (dark gray): Approximately 0.71, with error bars indicating a small range of uncertainty.
* Baseline (light blue): Approximately 0.59.
* **Function Codeword?:**
* OOCR (dark gray): Approximately 0.11, with error bars indicating a small range of uncertainty.
* Baseline (light blue): Approximately 0.00.
* **Function f(codeword):**
* OOCR (dark gray): Approximately 0.52, with error bars indicating a small range of uncertainty.
* Baseline (light blue): Approximately 0.50.
* **Function f(message):**
* OOCR (dark gray): Approximately 0.54, with error bars indicating a small range of uncertainty.
* Baseline (light blue): Approximately 0.53.
### Key Observations
* OOCR consistently outperforms Baseline in most tasks, especially "Multiple-choice codeword," "Describe the word," and "Best description."
* The performance gap between OOCR and Baseline is smallest for "Function f(codeword)" and "Function f(message)."
* OOCR performs poorly on "Function Codeword?" compared to other tasks.
### Interpretation
The data suggests that the OOCR system is significantly better than the Baseline system at tasks involving basic understanding and description, as indicated by the high scores in "Multiple-choice codeword," "Describe the word," and "Best description." However, the OOCR system struggles with the "Function Codeword?" task, indicating a potential weakness in handling specific types of functional code-related queries. The similar performance of both systems on "Function f(codeword)" and "Function f(message)" suggests that these tasks might be inherently difficult or that both systems have similar capabilities in these areas. The error bars provide an indication of the variability in the scores, which should be considered when interpreting the results.