\n
## Chart: Mean Score Comparison - OOCR vs. Baseline
### Overview
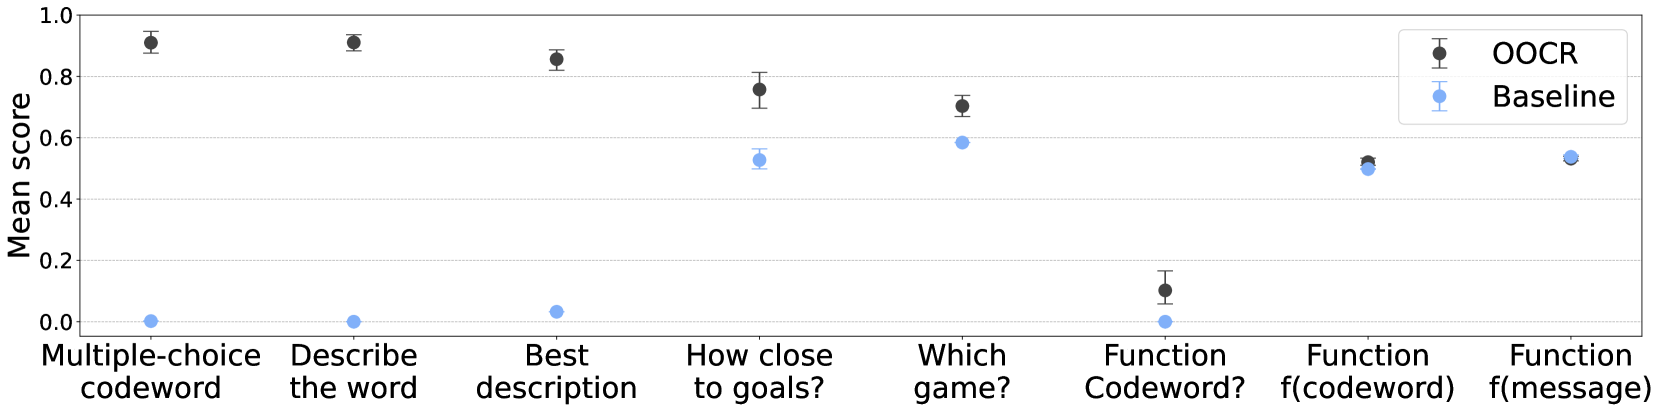
This chart compares the mean scores of two methods, "OOCR" and "Baseline", across seven different tasks. The chart is a point plot with error bars representing the variability in the scores. The x-axis represents the task name, and the y-axis represents the mean score.
### Components/Axes
* **X-axis Title:** Task Name
* **Y-axis Title:** Mean score
* **Data Series 1 (Black):** OOCR
* **Data Series 2 (Blue):** Baseline
* **Tasks (X-axis labels):** Multiple-choice codeword, Describe the word, Best description, How close to goals?, Which game?, Function Codeword?, Function f(codeword), Function f(message)
* **Y-axis Scale:** 0.0 to 1.0, with increments of 0.2.
* **Legend:** Located at the top-right corner of the chart, distinguishing between OOCR (black) and Baseline (blue).
### Detailed Analysis
The chart displays point plots with error bars for each task and each method.
* **Multiple-choice codeword:** OOCR: ~0.88, Baseline: ~0.05. The OOCR score is significantly higher.
* **Describe the word:** OOCR: ~0.92, Baseline: ~0.02. OOCR performs much better.
* **Best description:** OOCR: ~0.88, Baseline: ~0.08. OOCR has a substantially higher score.
* **How close to goals?:** OOCR: ~0.75, Baseline: ~0.52. OOCR outperforms Baseline.
* **Which game?:** OOCR: ~0.68, Baseline: ~0.62. OOCR is slightly better.
* **Function Codeword?:** OOCR: ~0.12, Baseline: ~0.02. OOCR has a higher score.
* **Function f(codeword):** OOCR: ~0.50, Baseline: ~0.48. Scores are very close.
* **Function f(message):** OOCR: ~0.50, Baseline: ~0.45. OOCR is slightly better.
The error bars indicate the variability of the scores. The error bars are relatively small for most data points, suggesting consistent performance within each task and method.
### Key Observations
* OOCR consistently outperforms Baseline on most tasks, particularly "Multiple-choice codeword", "Describe the word", and "Best description".
* The difference in performance between OOCR and Baseline is minimal for "Function f(codeword)" and "Function f(message)".
* The "Multiple-choice codeword" task shows the largest performance gap between the two methods.
* The Baseline method consistently scores near 0 for the first three tasks.
### Interpretation
The data suggests that the OOCR method is significantly more effective than the Baseline method for tasks involving understanding and describing code-related information, especially when the task requires selecting from multiple choices or providing a descriptive explanation. The tasks involving function calls ("Function f(codeword)" and "Function f(message)") show a smaller performance difference, indicating that both methods struggle with these more complex tasks. The consistently low scores of the Baseline method on the initial tasks suggest it may be fundamentally limited in its ability to process and understand code-related language. The error bars suggest that the results are relatively stable and not due to random fluctuations. The chart highlights the potential benefits of using OOCR for code understanding and analysis, particularly in scenarios where accurate interpretation of code-related text is crucial.