## Line Chart: NMSE vs. Frequency for Different Rooms
### Overview
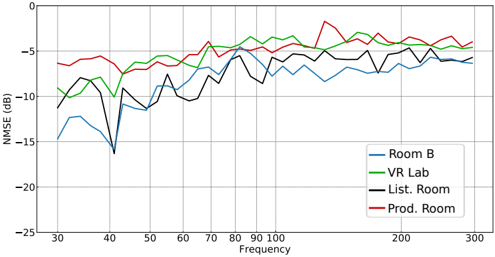
The image is a line chart comparing the Normalized Mean Square Error (NMSE) in decibels (dB) across different frequencies for four different rooms: Room B, VR Lab, Listening Room, and Production Room. The chart displays how the NMSE varies with frequency for each room, providing insights into the acoustic characteristics of each space.
### Components/Axes
* **X-axis:** Frequency (Hz), ranging from 30 to 300, with tick marks at approximately 30, 40, 50, 60, 70, 80, 90, 100, 200, and 300.
* **Y-axis:** NMSE (dB), ranging from -25 to 0, with tick marks at -25, -20, -15, -10, -5, and 0.
* **Legend:** Located in the bottom-right corner, identifying each line by room:
* Blue: Room B
* Green: VR Lab
* Black: Listening Room
* Red: Production Room
### Detailed Analysis
* **Room B (Blue):**
* Trend: Starts at approximately -14 dB at 30 Hz, drops sharply to around -16 dB at 42 Hz, then generally increases with frequency, reaching approximately -6 dB at 300 Hz.
* Data Points:
* 30 Hz: -14 dB
* 42 Hz: -16 dB
* 60 Hz: -11 dB
* 100 Hz: -9 dB
* 200 Hz: -8 dB
* 300 Hz: -6 dB
* **VR Lab (Green):**
* Trend: Starts at approximately -9 dB at 30 Hz, drops to -11 dB at 40 Hz, then increases and stabilizes around -4 dB to -6 dB from 80 Hz to 300 Hz.
* Data Points:
* 30 Hz: -9 dB
* 40 Hz: -11 dB
* 60 Hz: -8 dB
* 100 Hz: -4 dB
* 200 Hz: -4 dB
* 300 Hz: -6 dB
* **Listening Room (Black):**
* Trend: Starts at approximately -8 dB at 30 Hz, drops sharply to -16 dB at 42 Hz, then increases and stabilizes around -6 dB to -8 dB from 80 Hz to 300 Hz.
* Data Points:
* 30 Hz: -8 dB
* 42 Hz: -16 dB
* 60 Hz: -10 dB
* 100 Hz: -7 dB
* 200 Hz: -7 dB
* 300 Hz: -6 dB
* **Production Room (Red):**
* Trend: Starts at approximately -6 dB at 30 Hz, remains relatively stable between -5 dB and -7 dB from 30 Hz to 300 Hz, with some fluctuations.
* Data Points:
* 30 Hz: -6 dB
* 60 Hz: -7 dB
* 100 Hz: -6 dB
* 200 Hz: -6 dB
* 300 Hz: -5 dB
### Key Observations
* All rooms show a general trend of increasing NMSE with frequency, especially after the initial drop around 40 Hz.
* The Production Room exhibits the most stable NMSE across the frequency range.
* Room B and Listening Room show a significant dip in NMSE around 40 Hz.
* VR Lab has a relatively higher NMSE at lower frequencies compared to Room B and Listening Room after 40 Hz.
### Interpretation
The data suggests that the acoustic characteristics of each room vary significantly, especially at lower frequencies. The Production Room appears to have the most consistent performance across the frequency spectrum, indicating a more controlled acoustic environment. The dips in NMSE for Room B and the Listening Room around 40 Hz could indicate specific resonant frequencies or acoustic anomalies in those spaces. The VR Lab's higher NMSE at lower frequencies might be due to the specific design or equipment within that room. Overall, the chart provides valuable insights into the acoustic performance of each room, which could be used to optimize their design or usage for specific audio-related tasks.