## Line Graph: NMSE (dB) vs Frequency Across Different Rooms
### Overview
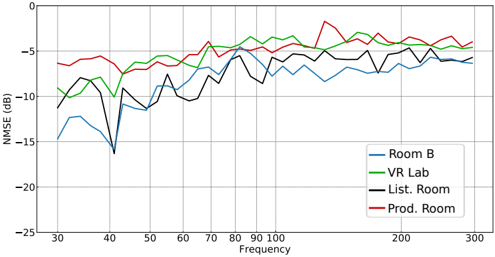
The image is a line graph comparing the Normalized Mean Squared Error (NMSE) in decibels (dB) across four different environments (Room B, VR Lab, List. Room, Prod. Room) as a function of frequency (Hz). The graph spans frequencies from 30 Hz to 300 Hz, with NMSE values ranging from -25 dB to 0 dB. Four distinct lines represent the data for each room, with color-coded legends for clarity.
---
### Components/Axes
- **X-axis (Frequency)**: Labeled "Frequency" with ticks at 30, 40, 50, ..., 300 Hz. The scale is linear.
- **Y-axis (NMSE)**: Labeled "NMSE (dB)" with ticks at -25, -20, -15, ..., 0 dB. The scale is linear.
- **Legend**: Located in the bottom-right corner, mapping colors to rooms:
- **Blue**: Room B
- **Green**: VR Lab
- **Black**: List. Room
- **Red**: Prod. Room
---
### Detailed Analysis
1. **Room B (Blue Line)**:
- **Trend**: Starts at ~-15 dB at 30 Hz, dips sharply to ~-18 dB at 40 Hz, then fluctuates with minor peaks and troughs. Ends near -5 dB at 300 Hz.
- **Key Points**:
- Sharp dip at 40 Hz (~-18 dB).
- Slight recovery to ~-10 dB at 50 Hz.
- Gradual increase to ~-5 dB at 300 Hz.
2. **VR Lab (Green Line)**:
- **Trend**: Relatively stable with minor fluctuations. Peaks at ~-3 dB at 100 Hz and ~-2 dB at 200 Hz. Ends near -4 dB at 300 Hz.
- **Key Points**:
- Smooth curve with no extreme dips.
- Slight upward trend toward higher frequencies.
3. **List. Room (Black Line)**:
- **Trend**: Starts at ~-10 dB at 30 Hz, drops sharply to ~-18 dB at 40 Hz, then fluctuates with peaks and troughs. Ends near -5 dB at 300 Hz.
- **Key Points**:
- Sharp dip at 40 Hz (~-18 dB).
- Recovery to ~-10 dB at 50 Hz.
- Oscillatory behavior with peaks at ~-5 dB (e.g., 70 Hz, 150 Hz).
4. **Prod. Room (Red Line)**:
- **Trend**: Most stable line with minimal fluctuations. Peaks at ~-2 dB at 100 Hz and ~-3 dB at 200 Hz. Ends near -4 dB at 300 Hz.
- **Key Points**:
- Consistent performance with no extreme dips.
- Slight upward trend toward higher frequencies.
---
### Key Observations
- **Sharp Dips**: Room B and List. Room exhibit significant drops at 40 Hz (~-18 dB), suggesting potential issues or anomalies at this frequency.
- **Stability**: Prod. Room shows the most consistent performance, with the least variation across frequencies.
- **Peaks**: VR Lab and Prod. Room have minor peaks at 100 Hz and 200 Hz, indicating possible resonance or measurement artifacts.
- **Convergence**: All lines converge near -5 dB at 300 Hz, suggesting similar performance at high frequencies.
---
### Interpretation
The data highlights differences in NMSE performance across environments. The **Prod. Room** demonstrates the most stable and reliable performance, with minimal fluctuations and no extreme dips. In contrast, **Room B** and **List. Room** show significant variability, particularly at 40 Hz, which may indicate environmental or measurement challenges. The **VR Lab** exhibits moderate stability but with slight upward trends at higher frequencies. These trends could reflect differences in room acoustics, equipment calibration, or experimental conditions. The sharp dips at 40 Hz in Room B and List. Room warrant further investigation to identify root causes, such as structural resonances or sensor limitations. Overall, the graph underscores the importance of environmental factors in NMSE measurements and highlights the Prod. Room as the optimal setting for consistent performance.