# Technical Document Extraction: Line Graph Analysis
## Axes and Labels
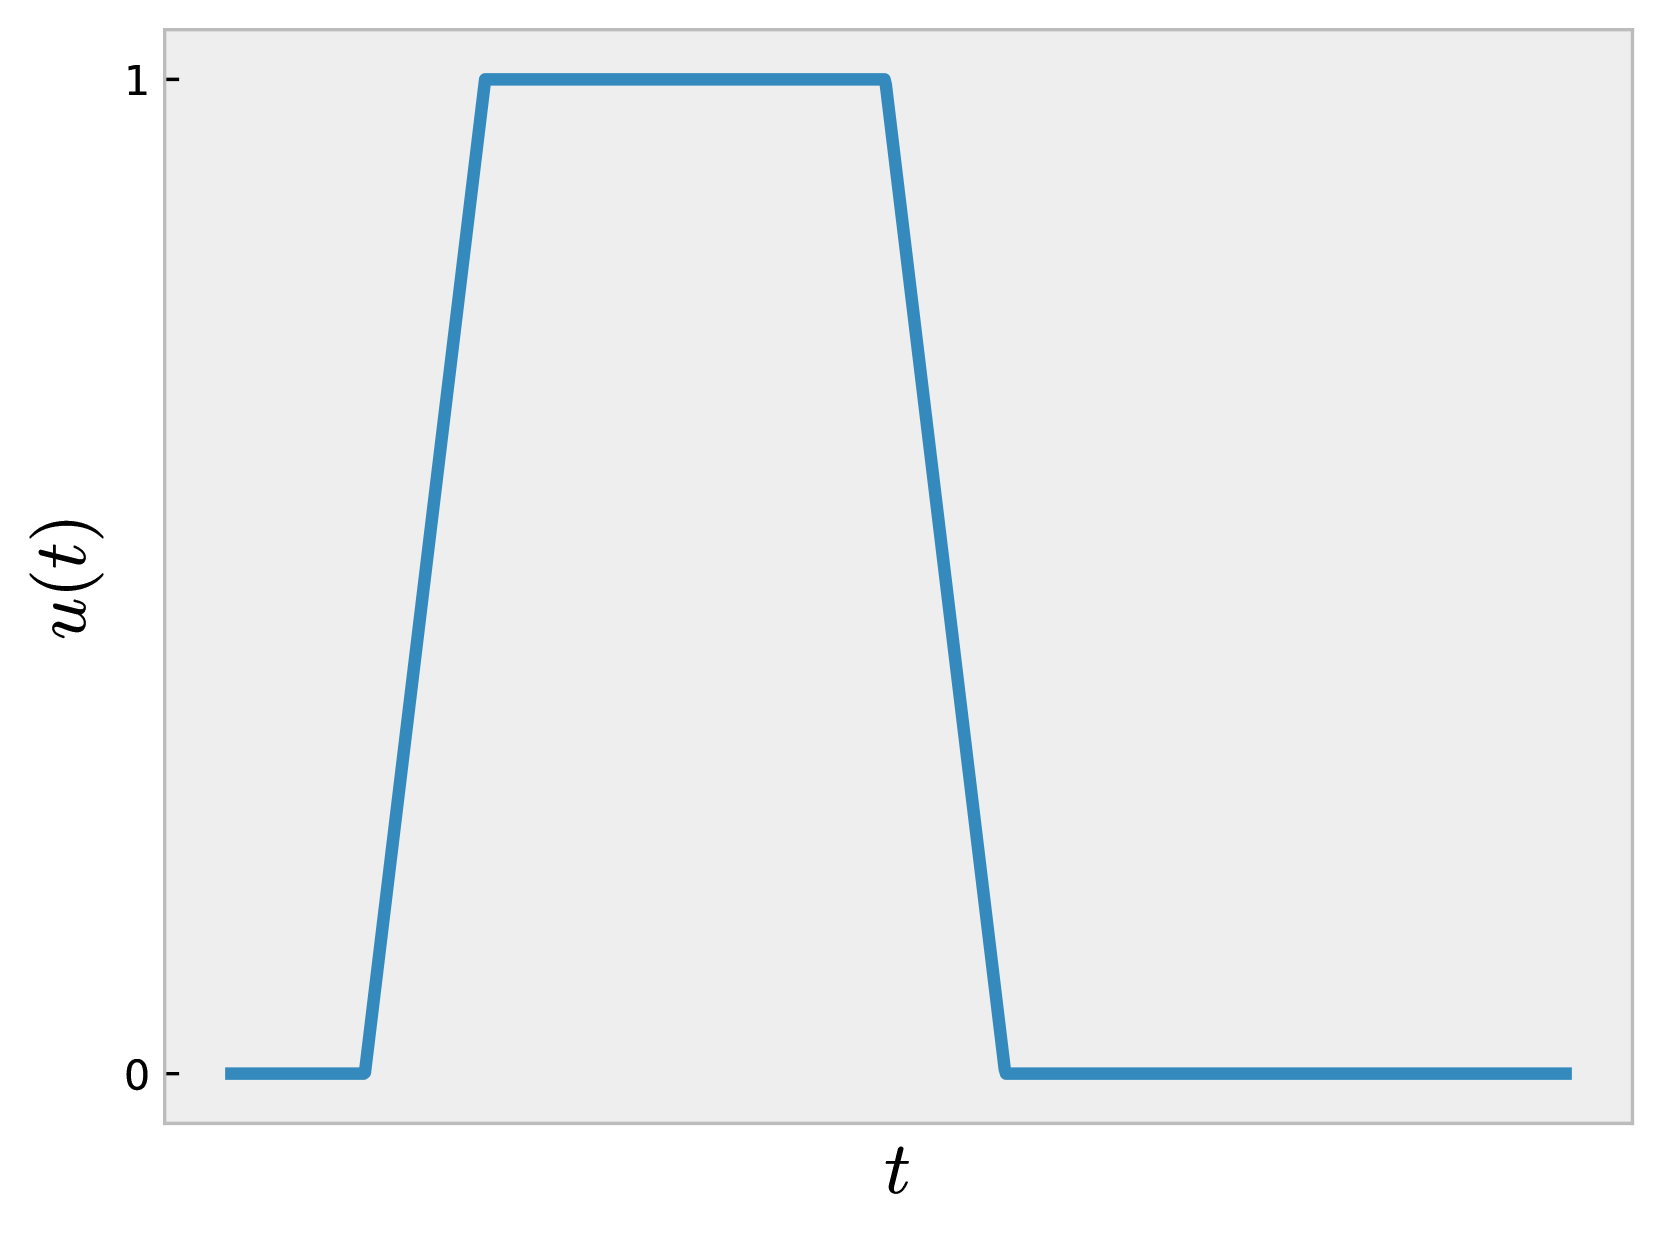
- **Y-Axis**: Labeled as $ u(t) $, representing the dependent variable.
- **X-Axis**: Labeled as $ t $, representing time or an independent variable.
- **Range**:
- Y-Axis: 0 to 1 (discrete steps, no intermediate values shown).
- X-Axis: Unspecified numerical range (no explicit markers or units provided).
## Line Behavior
- **Line Color**: Blue.
- **Key Trends**:
1. **Initial State**: $ u(t) = 0 $ for $ t < t_1 $.
2. **Rise**: Sharp linear increase from $ (t_1, 0) $ to $ (t_2, 1) $.
3. **Sustained State**: $ u(t) = 1 $ for $ t_2 \leq t \leq t_3 $.
4. **Drop**: Sharp linear decrease from $ (t_3, 1) $ to $ (t_4, 0) $.
5. **Final State**: $ u(t) = 0 $ for $ t > t_4 $.
## Critical Points
- **Transition Points**:
- $ t_1 $: Start of rise.
- $ t_2 $: End of rise (beginning of sustained state).
- $ t_3 $: Start of drop.
- $ t_4 $: End of drop (return to baseline).
## Observations
- **Discontinuities**: No intermediate values between $ u(t) = 0 $ and $ u(t) = 1 $; suggests a binary or threshold-based system.
- **Symmetry**: The rise and drop phases appear symmetric in slope magnitude but not in duration (unspecified $ t_1, t_2, t_3, t_4 $).
- **No Legend**: No additional categories or sub-categories defined.
## Notes
- The graph lacks explicit numerical values for $ t_1, t_2, t_3, t_4 $, making temporal resolution undefined.
- The absence of a legend or secondary lines suggests a single-variable system.