## Chart/Diagram Type: Correlation Analysis of Blind Spot Scores
### Overview
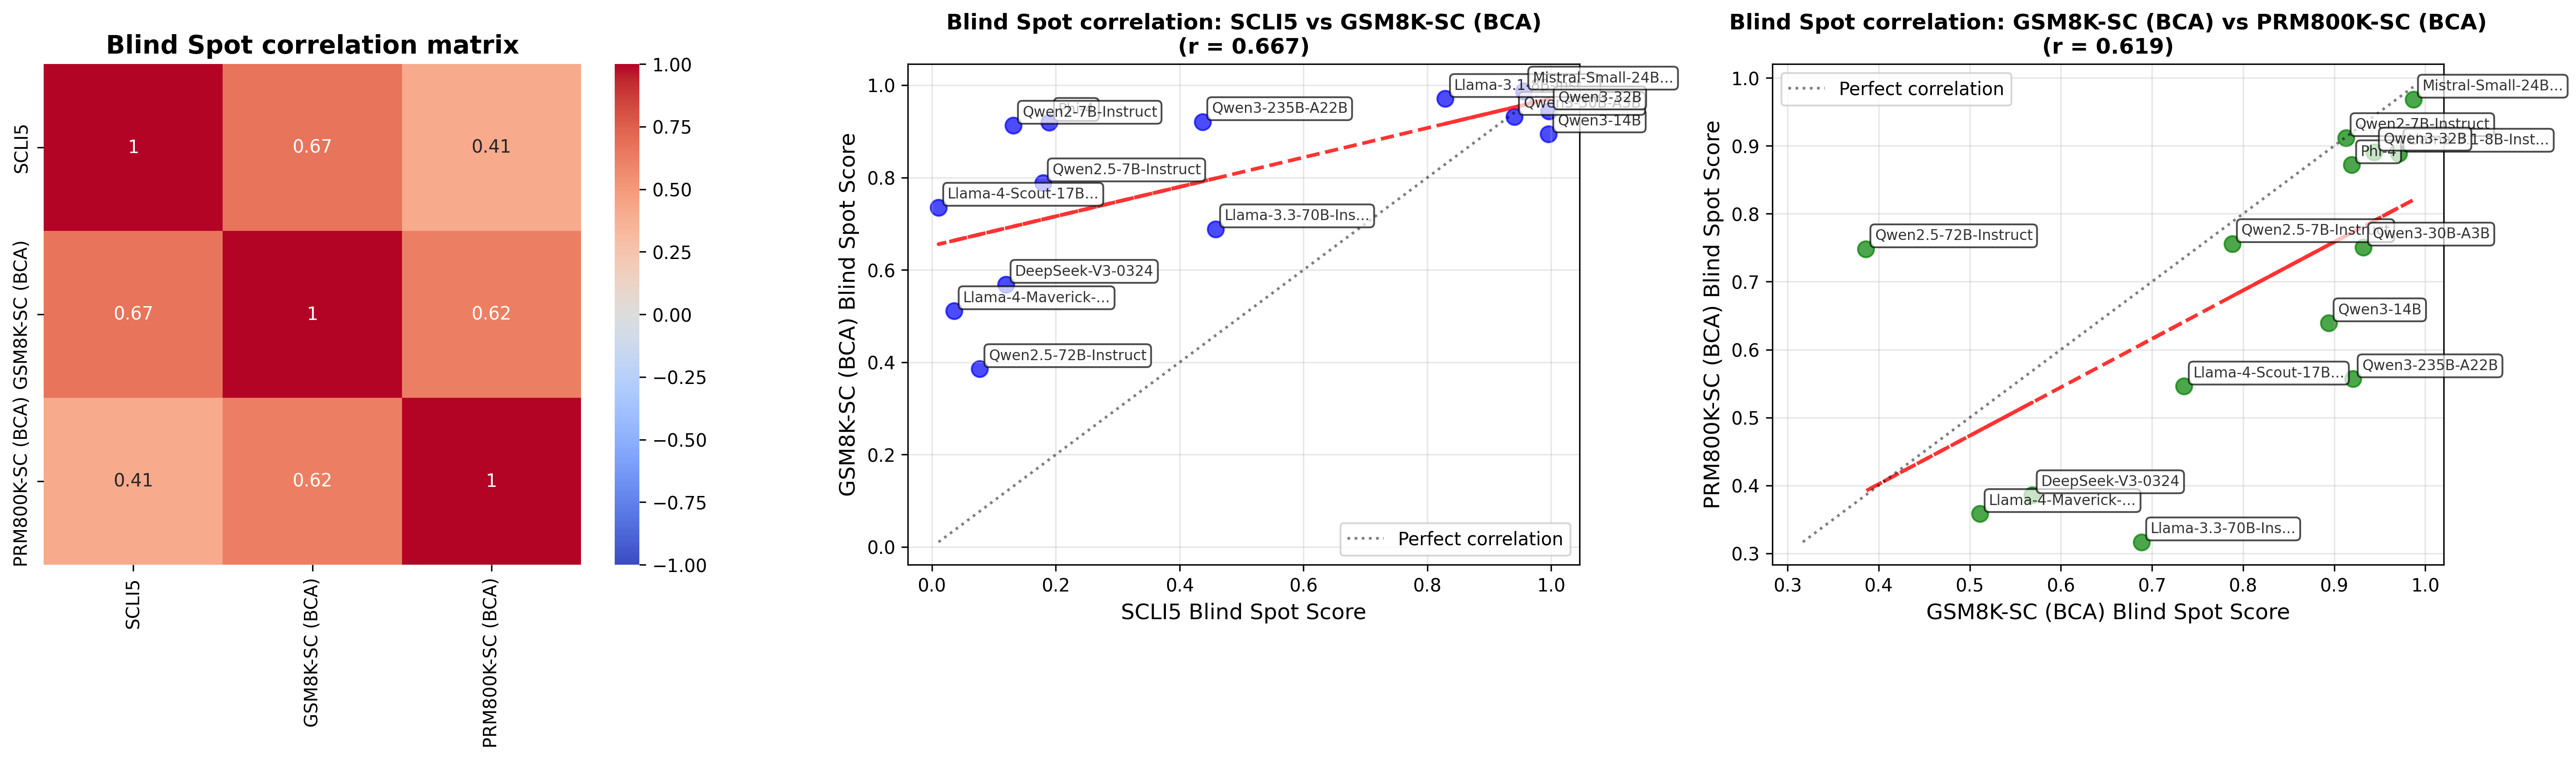
The image presents a correlation analysis of blind spot scores across different language models (SCL15, GSM8K-SC (BCA), and PRM800K-SC (BCA)). It includes a correlation matrix and two scatter plots comparing the blind spot scores of these models.
### Components/Axes
**1. Correlation Matrix (Left)**
* **Title:** Blind Spot correlation matrix
* **Axes Labels:**
* X-axis: SCL15, GSM8K-SC (BCA), PRM800K-SC (BCA)
* Y-axis: SCL15, GSM8K-SC (BCA), PRM800K-SC (BCA)
* **Color Scale:** Ranges from -1.00 (blue) to 1.00 (red), with 0.25 increments marked.
**2. Scatter Plot 1 (Center)**
* **Title:** Blind Spot correlation: SCL15 vs GSM8K-SC (BCA) (r = 0.667)
* **Axes Labels:**
* X-axis: SCLI5 Blind Spot Score
* Y-axis: GSM8K-SC (BCA) Blind Spot Score
* **Axis Scale:** Both axes range from 0.0 to 1.0, with 0.2 increments.
* **Data Points:** Blue circles, each labeled with a model name.
* **Trend Line:** Dashed red line.
* **Reference Line:** Dotted gray line labeled "Perfect correlation".
**3. Scatter Plot 2 (Right)**
* **Title:** Blind Spot correlation: GSM8K-SC (BCA) vs PRM800K-SC (BCA) (r = 0.619)
* **Axes Labels:**
* X-axis: GSM8K-SC (BCA) Blind Spot Score
* Y-axis: PRM800K-SC (BCA) Blind Spot Score
* **Axis Scale:** Both axes range from 0.3 to 1.0, with 0.1 increments.
* **Data Points:** Green circles, each labeled with a model name.
* **Trend Line:** Dashed red line.
* **Reference Line:** Dotted gray line labeled "Perfect correlation".
### Detailed Analysis or ### Content Details
**1. Correlation Matrix**
| | SCL15 | GSM8K-SC (BCA) | PRM800K-SC (BCA) |
| :---- | :---- | :------------- | :---------------- |
| SCL15 | 1 | 0.67 | 0.41 |
| GSM8K-SC (BCA) | 0.67 | 1 | 0.62 |
| PRM800K-SC (BCA) | 0.41 | 0.62 | 1 |
**2. Scatter Plot 1: SCL15 vs GSM8K-SC (BCA)**
* **Trend:** The dashed red line shows a positive correlation. As SCL15 blind spot score increases, GSM8K-SC (BCA) blind spot score tends to increase as well.
* **Data Points:**
* Qwen2-7B-Instruct: SCL15 ~0.1, GSM8K-SC ~0.9
* Qwen2.5-7B-Instruct: SCL15 ~0.15, GSM8K-SC ~0.8
* Qwen2.5-72B-Instruct: SCL15 ~0.15, GSM8K-SC ~0.4
* Llama-4-Scout-17B...: SCL15 ~0.2, GSM8K-SC ~0.5
* DeepSeek-V3-0324: SCL15 ~0.2, GSM8K-SC ~0.6
* Llama-4-Maverick-...: SCL15 ~0.2, GSM8K-SC ~0.5
* Llama-3.3-70B-Ins..: SCL15 ~0.6, GSM8K-SC ~0.7
* Qwen3-235B-A22B: SCL15 ~0.9, GSM8K-SC ~0.95
* Llama-3.1: SCL15 ~0.95, GSM8K-SC ~1.0
* Mistral-Small-24B...: SCL15 ~0.95, GSM8K-SC ~1.0
* Qwen3-32B: SCL15 ~0.95, GSM8K-SC ~0.95
* Qwen3-14B: SCL15 ~0.95, GSM8K-SC ~0.95
**3. Scatter Plot 2: GSM8K-SC (BCA) vs PRM800K-SC (BCA)**
* **Trend:** The dashed red line shows a positive correlation. As GSM8K-SC (BCA) blind spot score increases, PRM800K-SC (BCA) blind spot score tends to increase as well.
* **Data Points:**
* DeepSeek-V3-0324: GSM8K-SC ~0.5, PRM800K-SC ~0.4
* Llama-4-Maverick-...: GSM8K-SC ~0.5, PRM800K-SC ~0.35
* Llama-3.3-70B-Ins...: GSM8K-SC ~0.7, PRM800K-SC ~0.35
* Qwen2.5-72B-Instruct: GSM8K-SC ~0.4, PRM800K-SC ~0.75
* Llama-4-Scout-17B...: GSM8K-SC ~0.85, PRM800K-SC ~0.5
* Qwen3-235B-A22B: GSM8K-SC ~0.9, PRM800K-SC ~0.5
* Qwen3-14B: GSM8K-SC ~0.9, PRM800K-SC ~0.6
* Qwen2.5-7B-Instr: GSM8K-SC ~0.75, PRM800K-SC ~0.75
* Qwen3-30B-A3B: GSM8K-SC ~0.8, PRM800K-SC ~0.9
* Qwen2-7B-Instruct: GSM8K-SC ~0.9, PRM800K-SC ~0.95
* Qwen3-32B1-8B-Inst...: GSM8K-SC ~0.9, PRM800K-SC ~0.95
* Phi-4: GSM8K-SC ~0.9, PRM800K-SC ~0.95
* Mistral-Small-24B...: GSM8K-SC ~0.95, PRM800K-SC ~1.0
### Key Observations
* The correlation matrix shows moderate positive correlations between the blind spot scores of the three models.
* The scatter plots visually confirm these positive correlations, with data points generally trending upwards.
* The correlation coefficient (r) is 0.667 for SCL15 vs GSM8K-SC (BCA) and 0.619 for GSM8K-SC (BCA) vs PRM800K-SC (BCA), indicating a moderate positive linear relationship.
* The models exhibit a range of blind spot scores, with some models consistently scoring higher or lower across different benchmarks.
* The "Perfect correlation" line serves as a reference, showing how closely the models' scores align.
### Interpretation
The data suggests that there is a tendency for models with higher blind spot scores on one benchmark to also have higher scores on other benchmarks. However, the moderate correlation coefficients indicate that the relationship is not perfect, and there are variations in model performance across different benchmarks. This could be due to the specific characteristics of each benchmark or the different strengths and weaknesses of the models. The scatter plots provide a more detailed view of the relationship between the models' scores, highlighting specific models that deviate from the general trend. The correlation matrix provides a high-level overview of the relationships between the three models.