## Heatmap: Blind Spot Correlation Matrix
### Overview
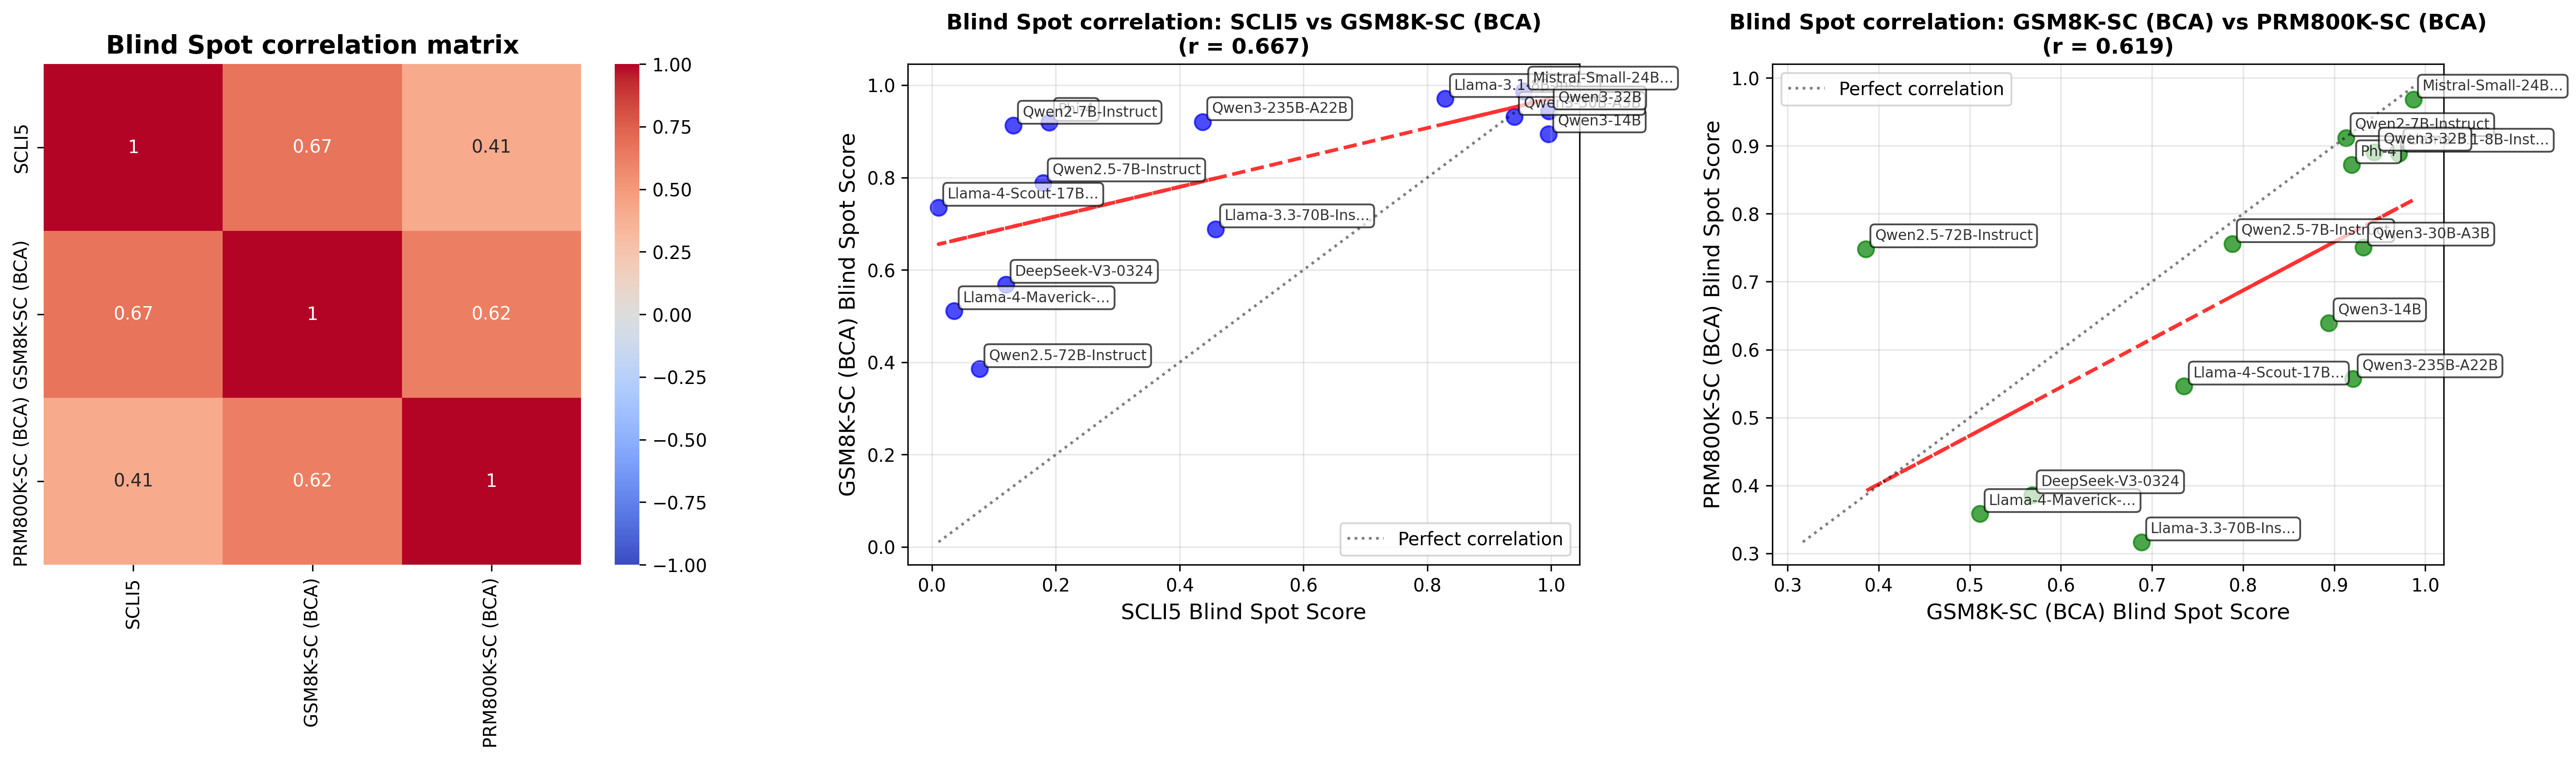
A 3x3 heatmap visualizing correlation coefficients between three models: SCLI5, GSM8K-SC (BCA), and PRM800K-SC (BCA). The diagonal shows perfect correlation (1.0), while off-diagonal values indicate pairwise correlations.
### Components/Axes
- **X-axis (rows)**: SCLI5, GSM8K-SC (BCA), PRM800K-SC (BCA)
- **Y-axis (columns)**: Same as X-axis
- **Color scale**: Blue (-1.0) to Red (1.0), with white at 0.0
- **Values**:
- SCLI5 vs SCLI5: 1.0
- SCLI5 vs GSM8K-SC (BCA): 0.67
- SCLI5 vs PRM800K-SC (BCA): 0.41
- GSM8K-SC (BCA) vs SCLI5: 0.67
- GSM8K-SC (BCA) vs GSM8K-SC (BCA): 1.0
- GSM8K-SC (BCA) vs PRM800K-SC (BCA): 0.62
- PRM800K-SC (BCA) vs SCLI5: 0.41
- PRM800K-SC (BCA) vs GSM8K-SC (BCA): 0.62
- PRM800K-SC (BCA) vs PRM800K-SC (BCA): 1.0
### Detailed Analysis
- **Correlation strengths**:
- SCLI5 and GSM8K-SC (BCA) show the strongest correlation (0.67).
- GSM8K-SC (BCA) and PRM800K-SC (BCA) have a moderate correlation (0.62).
- SCLI5 and PRM800K-SC (BCA) have the weakest correlation (0.41).
- **Color coding**: Reddish tones dominate, indicating positive correlations.
### Key Observations
- All models exhibit positive correlations, but none are perfectly aligned.
- The diagonal (1.0) confirms self-correlation.
- The heatmap highlights that SCLI5 and GSM8K-SC (BCA) are most similar in blind spot scores.
### Interpretation
The heatmap demonstrates that the models share some similarity in blind spot scores, with SCLI5 and GSM8K-SC (BCA) being the most correlated. The weaker correlation between SCLI5 and PRM800K-SC (BCA) suggests distinct characteristics in their blind spot metrics.
---
## Scatter Plot: SCLI5 vs GSM8K-SC (BCA)
### Overview
A scatter plot comparing SCLI5 and GSM8K-SC (BCA) blind spot scores, with a correlation coefficient of **r = 0.667**.
### Components/Axes
- **X-axis**: SCLI5 Blind Spot Score (0.0–1.0)
- **Y-axis**: GSM8K-SC (BCA) Blind Spot Score (0.0–1.0)
- **Trend lines**:
- Red dashed line: Linear regression trend (r = 0.667)
- Dotted line: Perfect correlation (y = x)
- **Data points**: Labeled with model names (e.g., "Qwen2.7B-Instruct", "Llama-4-Scout-17B...").
### Detailed Analysis
- **Trend**: The red dashed line slopes upward, indicating a positive relationship.
- **Data points**:
- Most points cluster near the trend line, with some deviation.
- Example: "Qwen2.7B-Instruct" (x ≈ 0.8, y ≈ 0.9) and "Llama-4-Scout-17B..." (x ≈ 0.7, y ≈ 0.8).
- **Color**: Blue and green points (no legend visible, but colors are distinct).
### Key Observations
- The correlation (r = 0.667) suggests a moderate positive relationship.
- Points like "Qwen3-32B" (x ≈ 0.9, y ≈ 0.95) align closely with the trend line.
- "Llama-4-Maverick..." (x ≈ 0.5, y ≈ 0.6) deviates slightly below the trend.
### Interpretation
The scatter plot confirms that higher SCLI5 scores generally correspond to higher GSM8K-SC (BCA) scores, but with variability. The trend line (r = 0.667) indicates a moderate linear relationship, while the dotted line (perfect correlation) highlights the gap between observed and ideal alignment.
---
## Scatter Plot: GSM8K-SC (BCA) vs PRM800K-SC (BCA)
### Overview
A scatter plot comparing GSM8K-SC (BCA) and PRM800K-SC (BCA) blind spot scores, with a correlation coefficient of **r = 0.619**.
### Components/Axes
- **X-axis**: GSM8K-SC (BCA) Blind Spot Score (0.0–1.0)
- **Y-axis**: PRM800K-SC (BCA) Blind Spot Score (0.0–1.0)
- **Trend lines**:
- Red dashed line: Linear regression trend (r = 0.619)
- Dotted line: Perfect correlation (y = x)
- **Data points**: Labeled with model names (e.g., "Qwen2.5-7B-Instruct", "Mistral-Small-24B...").
### Detailed Analysis
- **Trend**: The red dashed line slopes upward, indicating a positive relationship.
- **Data points**:
- Most points cluster near the trend line, with some deviation.
- Example: "Qwen2.5-7B-Instruct" (x ≈ 0.7, y ≈ 0.8) and "Mistral-Small-24B..." (x ≈ 0.9, y ≈ 0.95).
- **Color**: Green and blue points (no legend visible, but colors are distinct).
### Key Observations
- The correlation (r = 0.619) suggests a moderate positive relationship.
- Points like "Qwen3-32B" (x ≈ 0.8, y ≈ 0.9) align closely with the trend line.
- "Llama-4-Maverick..." (x ≈ 0.5, y ≈ 0.6) deviates slightly below the trend.
### Interpretation
The scatter plot shows that GSM8K-SC (BCA) and PRM800K-SC (BCA) have a moderate positive correlation, but the relationship is less strong than between SCLI5 and GSM8K-SC (BCA). The trend line (r = 0.619) indicates a linear relationship, while the dotted line (perfect correlation) underscores the gap between observed and ideal alignment.
---
## Interpretation Summary
1. **Model Similarity**:
- SCLI5 and GSM8K-SC (BCA) are most similar (r = 0.67).
- GSM8K-SC (BCA) and PRM800K-SC (BCA) show moderate similarity (r = 0.62).
- SCLI5 and PRM800K-SC (BCA) are least similar (r = 0.41).
2. **Trend Consistency**:
- All scatter plots show upward-sloping trend lines, confirming positive correlations.
- The strength of correlation decreases from SCLI5-GSM8K-SC (BCA) to GSM8K-SC (BCA)-PRM800K-SC (BCA).
3. **Outliers/Anomalies**:
- "Llama-4-Maverick..." (x ≈ 0.5, y ≈ 0.6) in the SCLI5-GSM8K-SC (BCA) plot deviates slightly below the trend line.
- "Llama-3.3-70B-Instruct..." (x ≈ 0.6, y ≈ 0.5) in the GSM8K-SC (BCA)-PRM800K-SC (BCA) plot also deviates below the trend.
4. **Implications**:
- The models share some underlying characteristics in blind spot scores, but differences exist.
- The heatmap and scatter plots together suggest that SCLI5 and GSM8K-SC (BCA) are more aligned in their blind spot metrics compared to other pairs.