## Multiple Line Charts: Speed, Absolute Magnitude, and Coefficients vs. Height
### Overview
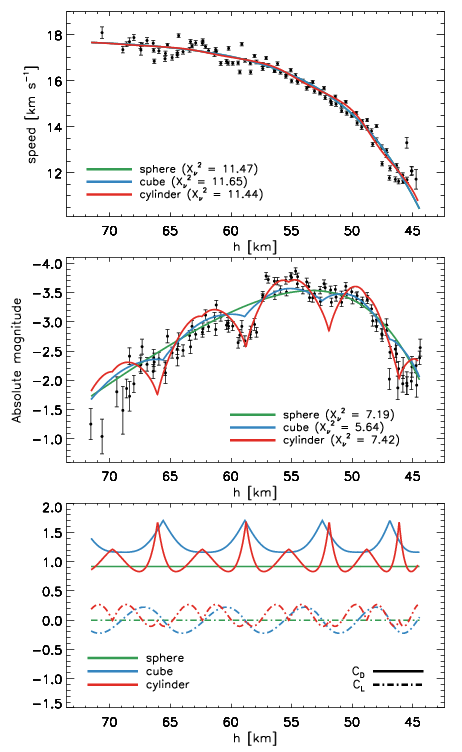
The image presents three line charts stacked vertically, each plotting data against height (h [km]). The top chart shows speed, the middle chart shows absolute magnitude, and the bottom chart shows coefficients. Each chart includes data for three shapes: sphere, cube, and cylinder. The top two charts also display error bars for the data points.
### Components/Axes
**Top Chart: Speed vs. Height**
* **Y-axis:** speed [km s⁻¹], ranging from 12 to 18.
* **X-axis:** h [km], ranging from 45 to 70.
* **Data Series:**
* **Green:** sphere (χ² = 11.47)
* **Blue:** cube (χ² = 11.65)
* **Red:** cylinder (χ² = 11.44)
* **Error Bars:** Present for each data point.
**Middle Chart: Absolute Magnitude vs. Height**
* **Y-axis:** Absolute magnitude, ranging from -1.0 to -4.0.
* **X-axis:** h [km], ranging from 45 to 70.
* **Data Series:**
* **Green:** sphere (χ² = 7.19)
* **Blue:** cube (χ² = 5.64)
* **Red:** cylinder (χ² = 7.42)
* **Error Bars:** Present for each data point.
**Bottom Chart: Coefficients vs. Height**
* **Y-axis:** No explicit label, but represents coefficient values ranging from -1.5 to 2.0.
* **X-axis:** h [km], ranging from 45 to 70.
* **Data Series:**
* **Green (solid):** sphere (C₀)
* **Blue (solid):** cube (C₀)
* **Red (solid):** cylinder (C₀)
* **Black (dashed):** C<sub>L</sub> (Applies to all shapes)
### Detailed Analysis
**Top Chart: Speed vs. Height**
* **Sphere (Green):** The speed starts at approximately 17.8 km s⁻¹ at 70 km height and decreases to approximately 14.5 km s⁻¹ at 45 km height.
* **Cube (Blue):** The speed starts at approximately 17.8 km s⁻¹ at 70 km height and decreases to approximately 14.5 km s⁻¹ at 45 km height.
* **Cylinder (Red):** The speed starts at approximately 17.8 km s⁻¹ at 70 km height and decreases to approximately 14.5 km s⁻¹ at 45 km height.
* **Trend:** All three lines (sphere, cube, cylinder) follow a similar downward trend, indicating a decrease in speed as height decreases. The lines are almost overlapping.
**Middle Chart: Absolute Magnitude vs. Height**
* **Sphere (Green):** The absolute magnitude starts at approximately -1.8 at 70 km height, increases to a peak around -3.3 at approximately 55 km height, and then decreases to approximately -2.2 at 45 km height.
* **Cube (Blue):** The absolute magnitude starts at approximately -1.8 at 70 km height, increases to a peak around -3.5 at approximately 55 km height, and then decreases to approximately -2.2 at 45 km height.
* **Cylinder (Red):** The absolute magnitude starts at approximately -2.1 at 70 km height, increases to a peak around -3.7 at approximately 55 km height, and then decreases to approximately -2.4 at 45 km height.
* **Trend:** All three lines show a similar trend: an initial increase in absolute magnitude as height decreases, followed by a decrease in absolute magnitude as height further decreases.
**Bottom Chart: Coefficients vs. Height**
* **Sphere (Green, solid):** The C₀ coefficient for the sphere is approximately constant at 0.0.
* **Cube (Blue, solid):** The C₀ coefficient for the cube oscillates between approximately 1.2 and 1.7.
* **Cylinder (Red, solid):** The C₀ coefficient for the cylinder oscillates between approximately 0.8 and 1.7.
* **C<sub>L</sub> (Black, dashed):** The C<sub>L</sub> coefficient oscillates between approximately -0.2 and 0.3.
* **Trend:** The C₀ coefficients for the cube and cylinder show periodic oscillations, while the sphere's C₀ remains relatively constant. The C<sub>L</sub> coefficient also oscillates with height.
### Key Observations
* The speed of all three shapes (sphere, cube, cylinder) decreases with decreasing height.
* The absolute magnitude of all three shapes initially increases and then decreases as height decreases.
* The C₀ coefficients for the cube and cylinder oscillate with height, while the sphere's C₀ remains relatively constant.
* The C<sub>L</sub> coefficient oscillates with height.
### Interpretation
The charts suggest that the shape of an object influences its aerodynamic properties (represented by the coefficients) and its interaction with the environment, as reflected in its speed and absolute magnitude at different heights. The similar trends in speed and absolute magnitude for all three shapes indicate that height is a dominant factor, but the differences in the coefficient oscillations suggest that shape plays a role in modulating these interactions. The chi-squared values (χ²) provided in the legends indicate the goodness of fit for each shape's model to the observed data. Lower χ² values generally indicate a better fit.