## Charts: Atmospheric Re-entry Data
### Overview
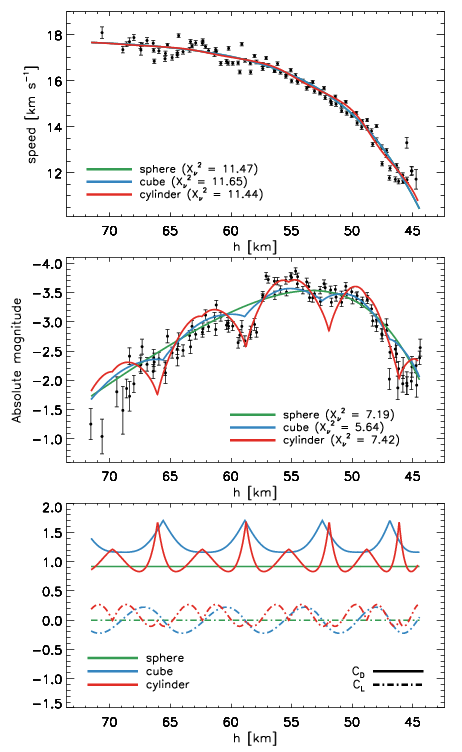
The image presents three charts displaying data related to atmospheric re-entry, likely of objects with different shapes (sphere, cube, cylinder). The charts plot speed, absolute magnitude, and drag coefficients against altitude (h). Each chart includes data for each shape, represented by different colored lines, along with error bars indicating uncertainty. Chi-squared values (χ²) are provided for each fit.
### Components/Axes
* **X-axis (all charts):** Altitude 'h' in kilometers (km), ranging from approximately 45 km to 72 km.
* **Top Chart:**
* **Y-axis:** Speed in kilometers per second (km s⁻¹), ranging from approximately 12 km s⁻¹ to 18 km s⁻¹.
* **Legend (top-right):**
* Sphere (Red) - χ² = 11.47
* Cube (Blue) - χ² = 11.65
* Cylinder (Black) - χ² = 11.44
* **Middle Chart:**
* **Y-axis:** Absolute Magnitude, ranging from approximately -4.0 to -1.0.
* **Legend (top-right):**
* Sphere (Red) - χ² = 7.19
* Cube (Blue) - χ² = 5.642
* Cylinder (Black) - χ² = 7.42
* **Bottom Chart:**
* **Y-axis:** Drag Coefficient (Cd and CL), ranging from approximately -1.5 to 2.0.
* **Legend (top-right):**
* Sphere (Red)
* Cube (Blue)
* Cylinder (Black)
* Cd (Black dashed line)
* CL (Black dotted line)
### Detailed Analysis
**Top Chart (Speed vs. Altitude):**
All three lines show a decreasing trend in speed as altitude decreases. The sphere (red) starts at approximately 17.8 km/s at 72 km and decreases to approximately 13.2 km/s at 45 km. The cube (blue) starts at approximately 17.5 km/s at 72 km and decreases to approximately 13.0 km/s at 45 km. The cylinder (black) starts at approximately 17.7 km/s at 72 km and decreases to approximately 13.1 km/s at 45 km. Error bars are present throughout the chart, indicating uncertainty in the speed measurements.
**Middle Chart (Absolute Magnitude vs. Altitude):**
The sphere (red) shows a peak in absolute magnitude around 55 km, reaching approximately -2.5. The cube (blue) shows a more gradual increase and peak around 52 km, reaching approximately -2.3. The cylinder (black) shows a similar peak around 53 km, reaching approximately -2.7. All three lines exhibit error bars.
**Bottom Chart (Drag Coefficient vs. Altitude):**
The sphere (red) shows an oscillating drag coefficient with a period of approximately 10 km, ranging from approximately 0.5 to 1.5. The cube (blue) also shows oscillations, but with a different phase and amplitude, ranging from approximately -0.5 to 1.0. The cylinder (black) shows similar oscillations, with a phase between the sphere and cube. The dashed black line represents Cd, remaining relatively constant around 0.0. The dotted black line represents CL, remaining relatively constant around -1.0.
### Key Observations
* The sphere generally experiences the highest speed throughout the descent.
* The cylinder exhibits the highest absolute magnitude.
* The drag coefficients oscillate significantly for all three shapes, indicating complex aerodynamic behavior during re-entry.
* The chi-squared values are relatively similar for all shapes in the top and middle charts, suggesting a comparable goodness of fit for the models used.
* The error bars indicate a significant degree of uncertainty in the measurements, particularly in the middle chart.
### Interpretation
These charts likely represent a simulation or experimental data from atmospheric re-entry tests of objects with different geometries. The decreasing speed with decreasing altitude is expected due to atmospheric drag. The absolute magnitude likely relates to the brightness of the object during re-entry, influenced by heating and ionization of the surrounding air. The oscillating drag coefficients suggest complex flow patterns around the objects as they descend through the atmosphere. The differences in behavior between the sphere, cube, and cylinder highlight the importance of shape in determining re-entry characteristics. The constant Cd and CL values suggest these are baseline values for comparison. The data suggests that the cylinder experiences the most intense heating (highest absolute magnitude) during re-entry, while the sphere maintains the highest speed. The oscillations in drag coefficient indicate unsteady aerodynamic forces acting on the objects. The chi-squared values provide a measure of how well the data fits the models used, with lower values indicating a better fit.