TECHNICAL ASSET FINGERPRINT
69a3027805fc544b6c105a72
Click to view fullscreen
Press ESC or click to close
FOUND IN PAPERS
EXPERT: healer-alpha-free VERSION 1
RUNTIME: free/openrouter/healer-alpha
INTEL_VERIFIED
\n
## Scientific Plot Analysis: Atmospheric Entry Simulation Data
### Overview
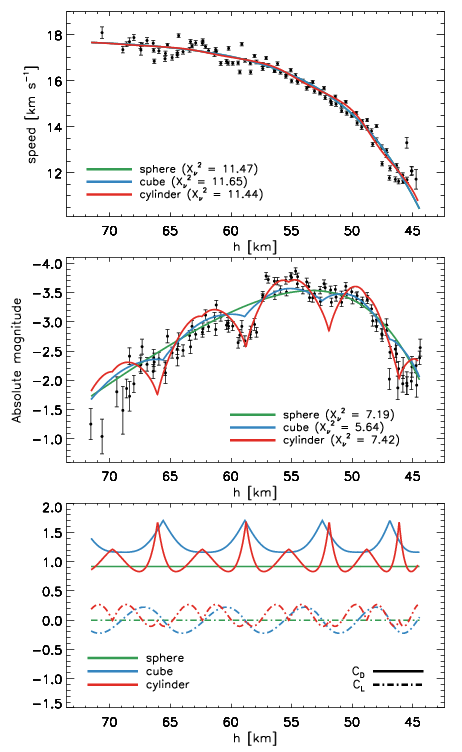
The image contains three vertically stacked scientific plots comparing the behavior of three geometric shapes (sphere, cube, cylinder) during what appears to be atmospheric entry or descent. The plots show speed, absolute magnitude, and model coefficients as a function of decreasing altitude (h). All text is in English.
### Components/Axes
**Common Elements:**
- **X-axis (all plots):** Labeled "h [km]" (altitude in kilometers). The axis is inverted, with values decreasing from left (70 km) to right (45 km), indicating descent.
- **Data Series:** Three shapes are consistently compared:
- **Sphere:** Green line
- **Cube:** Blue line
- **Cylinder:** Red line
- **Legends:** Positioned within each plot's frame (top-left for plots 1 & 2, bottom-left for plot 3). Each entry includes the shape name and a chi-squared (χ²) goodness-of-fit value in parentheses.
**Plot 1 (Top): Speed vs. Altitude**
- **Y-axis:** Labeled "speed [km s⁻¹]" (kilometers per second). Scale ranges from 12 to 18.
- **Legend:** Located in the top-left quadrant.
- sphere (χ² = 11.47)
- cube (χ² = 11.65)
- cylinder (χ² = 11.44)
- **Data:** Black points with vertical error bars represent measured data. Colored lines are model fits.
**Plot 2 (Middle): Absolute Magnitude vs. Altitude**
- **Y-axis:** Labeled "Absolute magnitude". Scale ranges from -1.0 to -4.0 (note: more negative values indicate greater brightness).
- **Legend:** Located in the bottom-left quadrant.
- sphere (χ² = 7.19)
- cube (χ² = 5.64)
- cylinder (χ² = 7.42)
- **Data:** Black points with vertical error bars represent measured data. Colored lines are model fits.
**Plot 3 (Bottom): Model Coefficients vs. Altitude**
- **Y-axis:** Unlabeled, but numerical scale ranges from -1.5 to 2.0.
- **Legend:** Located in the bottom-left quadrant. It defines two line styles and the three shapes.
- **Line Styles:**
- Solid line: C₀
- Dash-dotted line: C₁
- **Shapes:** sphere (green), cube (blue), cylinder (red)
- **Data:** Six lines are plotted (C₀ and C₁ for each shape). No error bars or data points are shown.
### Detailed Analysis
**Plot 1: Speed vs. Altitude**
- **Trend Verification:** All three model lines show a consistent downward slope from left to right, indicating speed decreases as altitude decreases (descent).
- **Data Points:** The measured data (black points) cluster tightly around the model lines, especially between 65-50 km. Scatter increases slightly at the highest (~70 km) and lowest (~45 km) altitudes.
- **Model Comparison:** The sphere (green) and cylinder (red) fits are nearly identical and track the central tendency of the data closely. The cube (blue) fit is slightly higher than the others between 60-50 km. The χ² values are very close (11.44 to 11.65), indicating similarly good fits for all three shapes.
**Plot 2: Absolute Magnitude vs. Altitude**
- **Trend Verification:** The data and models show a non-monotonic trend. Magnitude becomes more negative (brighter) from 70 km to a peak brightness around 55 km, then becomes less negative (dimmer) from 55 km to 45 km.
- **Data Points:** The measured data shows significant scatter and larger error bars compared to the speed plot. There is a notable dip in brightness (less negative magnitude) around 60 km.
- **Model Comparison:** The cube model (blue, χ²=5.64) provides the best fit to the data, particularly capturing the peak brightness near 55 km. The sphere (green) and cylinder (red) models underestimate the peak brightness. The cylinder model shows a sharp, unexplained dip near 52 km.
**Plot 3: Model Coefficients (C₀ and C₁)**
- **Component Isolation:** This plot is segmented into two distinct behaviors.
- **C₀ (Solid Lines):** The sphere's C₀ is constant at 1.0. The cube's C₀ oscillates between ~1.0 and ~1.7 with a regular period. The cylinder's C₀ shows sharper, narrower peaks reaching ~1.8, also periodic.
- **C₁ (Dash-dotted Lines):** All C₁ values are small (between -0.3 and 0.3). The sphere's C₁ is constant at 0.0. The cube's C₁ oscillates in anti-phase with its C₀. The cylinder's C₁ also oscillates with a smaller amplitude.
- **Spatial Grounding:** The oscillations in C₀ and C₁ for the cube and cylinder are perfectly synchronized in altitude, suggesting they are coupled parameters in the model.
### Key Observations
1. **Shape-Dependent Fit Quality:** No single shape is the best fit for all measured parameters. The cube best fits the magnitude data, while sphere and cylinder are marginally better for speed.
2. **Brightness Peak:** The absolute magnitude data shows a clear peak in brightness (most negative value) at an altitude of approximately 55 km.
3. **Oscillatory Coefficients:** For non-spherical shapes (cube, cylinder), the model coefficients C₀ and C₁ are not constant but oscillate with altitude, indicating a periodic physical process (e.g., tumbling or changing cross-section).
4. **Data Scatter:** The magnitude measurements have significantly more noise/scatter than the speed measurements.
### Interpretation
This data likely comes from a study simulating or observing the atmospheric entry of objects with different geometries. The plots collectively demonstrate that an object's shape critically influences its observable characteristics during descent.
- **Physical Meaning:** The speed plot shows expected deceleration due to atmospheric drag. The magnitude plot suggests the object heats up and glows brightest around 55 km altitude, likely due to peak aerodynamic heating. The coefficient plot reveals that for non-spherical objects, the model parameters governing the interaction (perhaps related to drag or luminous efficiency) are not static but vary periodically, strongly implying the objects are tumbling or rotating, changing their presented cross-sectional area and orientation relative to the flow.
- **Why It Matters:** The analysis shows that using a simple spherical model to interpret data from an irregularly shaped object (like an asteroid or spacecraft debris) could lead to errors, particularly in estimating brightness or interpreting light curves. The oscillatory coefficients provide a potential signature to infer shape or rotational state from remote observations.
- **Anomaly:** The sharp dip in the cylinder's magnitude model near 52 km is an artifact not supported by the data points and may indicate a numerical instability or an oversimplification in the model for that specific geometry at that altitude.
DECODING INTELLIGENCE...