## Chart: Accuracy vs. DTR for AIME 25 and GPQA-D
### Overview
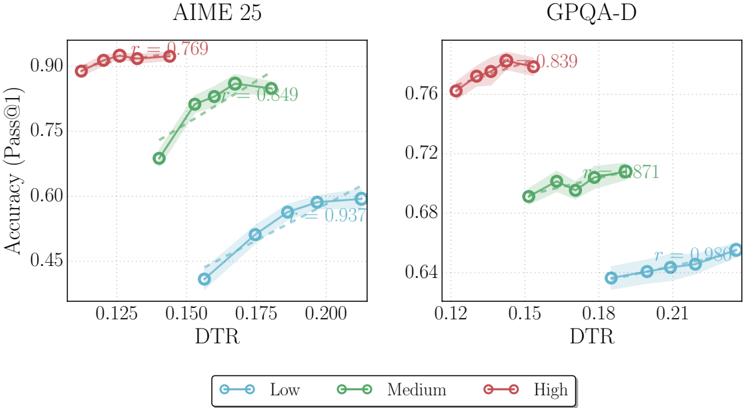
The image presents two line charts comparing the accuracy of different models (AIME 25 and GPQA-D) as a function of Data Transfer Rate (DTR). Accuracy is measured as Pass@1. Each chart displays three lines representing different levels of "something" (Low, Medium, High) indicated by color.
### Components/Axes
* **X-axis:** Data Transfer Rate (DTR). The scale ranges from approximately 0.125 to 0.21.
* **Y-axis:** Accuracy (Pass@1). The scale ranges from approximately 0.4 to 0.9.
* **Left Chart Title:** AIME 25
* **Right Chart Title:** GPQA-D
* **Legend:** Located at the bottom-center of the image.
* Low (Light Blue)
* Medium (Green)
* High (Red)
### Detailed Analysis or Content Details
**AIME 25 Chart (Left)**
* **High (Red):** The line is relatively flat, starting at approximately 0.90 accuracy at DTR 0.125 and remaining around 0.89-0.90 until DTR 0.20. A value of 0.769 is annotated at approximately DTR 0.16.
* **Medium (Green):** The line slopes upward from approximately 0.75 accuracy at DTR 0.125 to approximately 0.85 accuracy at DTR 0.175, then plateaus. A value of 0.849 is annotated at approximately DTR 0.175.
* **Low (Light Blue):** The line shows a clear upward trend, starting at approximately 0.45 accuracy at DTR 0.125 and increasing to approximately 0.60 accuracy at DTR 0.20. A value of 0.937 is annotated at approximately DTR 0.20.
**GPQA-D Chart (Right)**
* **High (Red):** The line slopes downward from approximately 0.77 accuracy at DTR 0.12 to approximately 0.74 accuracy at DTR 0.21. A value of 0.839 is annotated at approximately DTR 0.13.
* **Medium (Green):** The line slopes upward from approximately 0.68 accuracy at DTR 0.12 to approximately 0.72 accuracy at DTR 0.18, then plateaus. A value of 0.871 is annotated at approximately DTR 0.18.
* **Low (Light Blue):** The line is relatively flat, starting at approximately 0.65 accuracy at DTR 0.12 and remaining around 0.65-0.66 until DTR 0.21. A value of 0.936 is annotated at approximately DTR 0.21.
### Key Observations
* In the AIME 25 chart, the "High" level consistently exhibits the highest accuracy across all DTR values. The "Low" level shows the most significant improvement in accuracy as DTR increases.
* In the GPQA-D chart, the "High" level starts with the highest accuracy but decreases as DTR increases. The "Medium" level shows a slight increase in accuracy before plateauing. The "Low" level remains relatively constant.
* The annotated values appear to highlight specific points on the curves, potentially representing key performance thresholds or points of interest.
### Interpretation
The charts compare the performance of two models, AIME 25 and GPQA-D, under varying Data Transfer Rates (DTR) and different levels (Low, Medium, High). The "levels" likely represent different configurations or complexities within the models or datasets used for evaluation.
For AIME 25, higher levels consistently achieve better accuracy, and increasing DTR improves accuracy for lower levels. This suggests that AIME 25 benefits from both increased complexity and higher data transfer rates.
GPQA-D exhibits a different behavior. While the high level starts strong, its accuracy decreases with increasing DTR, potentially indicating a limitation or bottleneck in its architecture or data handling. The medium level shows some improvement, while the low level remains stable.
The contrasting trends between the two models suggest they have different strengths and weaknesses. AIME 25 appears to scale well with both complexity and data transfer, while GPQA-D may be more sensitive to DTR and potentially limited by its high-level configuration. The annotated values likely represent specific performance targets or points of interest for each model and level.