## Line Charts: AIME 25 and GPQA-D Performance vs. DTR
### Overview
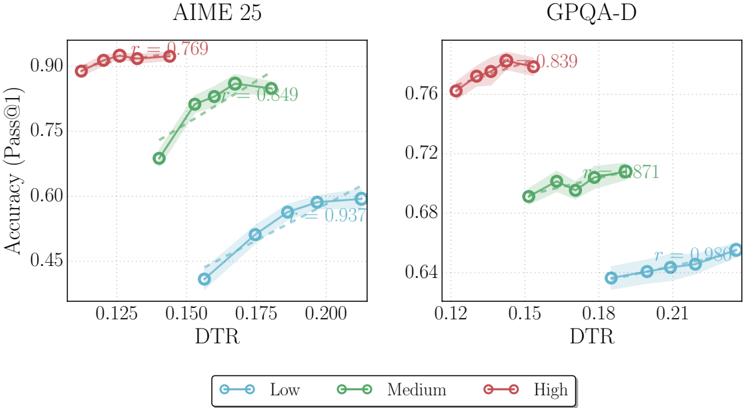
The image contains two line charts comparing accuracy (Pass@1) against DTR (Dynamic Threshold Rate) for three performance categories: Low, Medium, and High. Each chart represents a different evaluation framework (AIME 25 and GPQA-D), with distinct accuracy ranges and DTR scales.
### Components/Axes
- **AIME 25 Chart**:
- **Y-axis**: Accuracy (Pass@1) ranging from 0.45 to 0.90.
- **X-axis**: DTR ranging from 0.125 to 0.200.
- **Legend**:
- Blue (Low), Green (Medium), Red (High).
- **Data Series**:
- High (Red): Starts at ~0.90 accuracy, trends slightly downward.
- Medium (Green): Starts at ~0.75, trends upward.
- Low (Blue): Starts at ~0.45, trends upward steeply.
- **Correlation Coefficients (r)**:
- High: 0.769
- Medium: 0.849
- Low: 0.937
- **GPQA-D Chart**:
- **Y-axis**: Accuracy (Pass@1) ranging from 0.64 to 0.76.
- **X-axis**: DTR ranging from 0.12 to 0.21.
- **Legend**:
- Blue (Low), Green (Medium), Red (High).
- **Data Series**:
- High (Red): Starts at ~0.76, trends slightly downward.
- Medium (Green): Starts at ~0.68, trends upward.
- Low (Blue): Starts at ~0.64, trends upward steeply.
- **Correlation Coefficients (r)**:
- High: 0.839
- Medium: 0.871
- Low: 0.980
### Detailed Analysis
#### AIME 25 Chart
- **High (Red)**: Accuracy decreases marginally from ~0.90 at DTR=0.125 to ~0.88 at DTR=0.200.
- **Medium (Green)**: Accuracy increases from ~0.75 at DTR=0.125 to ~0.82 at DTR=0.175.
- **Low (Blue)**: Accuracy rises sharply from ~0.45 at DTR=0.125 to ~0.60 at DTR=0.200.
#### GPQA-D Chart
- **High (Red)**: Accuracy decreases slightly from ~0.76 at DTR=0.12 to ~0.74 at DTR=0.21.
- **Medium (Green)**: Accuracy increases from ~0.68 at DTR=0.12 to ~0.72 at DTR=0.18.
- **Low (Blue)**: Accuracy rises sharply from ~0.64 at DTR=0.12 to ~0.68 at DTR=0.21.
### Key Observations
1. **Inverse Relationship for High Category**: Both charts show the High category (Red) exhibits a weak negative correlation (r=0.769–0.839), suggesting accuracy declines slightly as DTR increases.
2. **Strong Positive Correlation for Low Category**: The Low category (Blue) demonstrates the strongest positive correlation (r=0.937–0.980), with accuracy increasing sharply as DTR rises.
3. **Medium Category Trends**: The Medium category (Green) shows moderate positive correlation (r=0.849–0.871), with accuracy improving as DTR increases but less steeply than the Low category.
4. **DTR Range Differences**: AIME 25 spans a broader DTR range (0.125–0.200) compared to GPQA-D (0.12–0.21), but both show similar trends.
### Interpretation
- **Performance Sensitivity**: The Low category’s high correlation coefficients (r > 0.9) indicate it is most responsive to DTR adjustments, suggesting dynamic thresholding significantly impacts lower-performing systems.
- **High Category Anomaly**: The High category’s negative correlation (r < 0.85) implies that increasing DTR may inadvertently reduce accuracy for top-performing systems, possibly due to over-optimization or threshold misalignment.
- **Framework Differences**: GPQA-D’s narrower accuracy range (0.64–0.76) vs. AIME 25’s wider range (0.45–0.90) suggests AIME 25 evaluates more diverse or challenging tasks, where DTR adjustments have a more pronounced effect on lower-performing systems.
### Spatial Grounding & Validation
- Legends are positioned at the bottom center, with colors matching line markers (blue=Low, green=Medium, red=High).
- Data points align with legend colors: e.g., AIME 25’s High (Red) starts at (0.125, 0.90), Medium (Green) at (0.125, 0.75), and Low (Blue) at (0.125, 0.45).
- Correlation coefficients are annotated near each line, confirming trend strength.
### Conclusion
The charts reveal that dynamic thresholding (DTR) has a non-linear impact on accuracy, with lower-performing systems benefiting most from increased DTR. The High category’s inverse relationship warrants further investigation to determine if threshold adjustments should be tailored differently for top-tier systems.