## Combination Chart: NAQ and ViSQOL Metrics vs. γ Parameter
### Overview
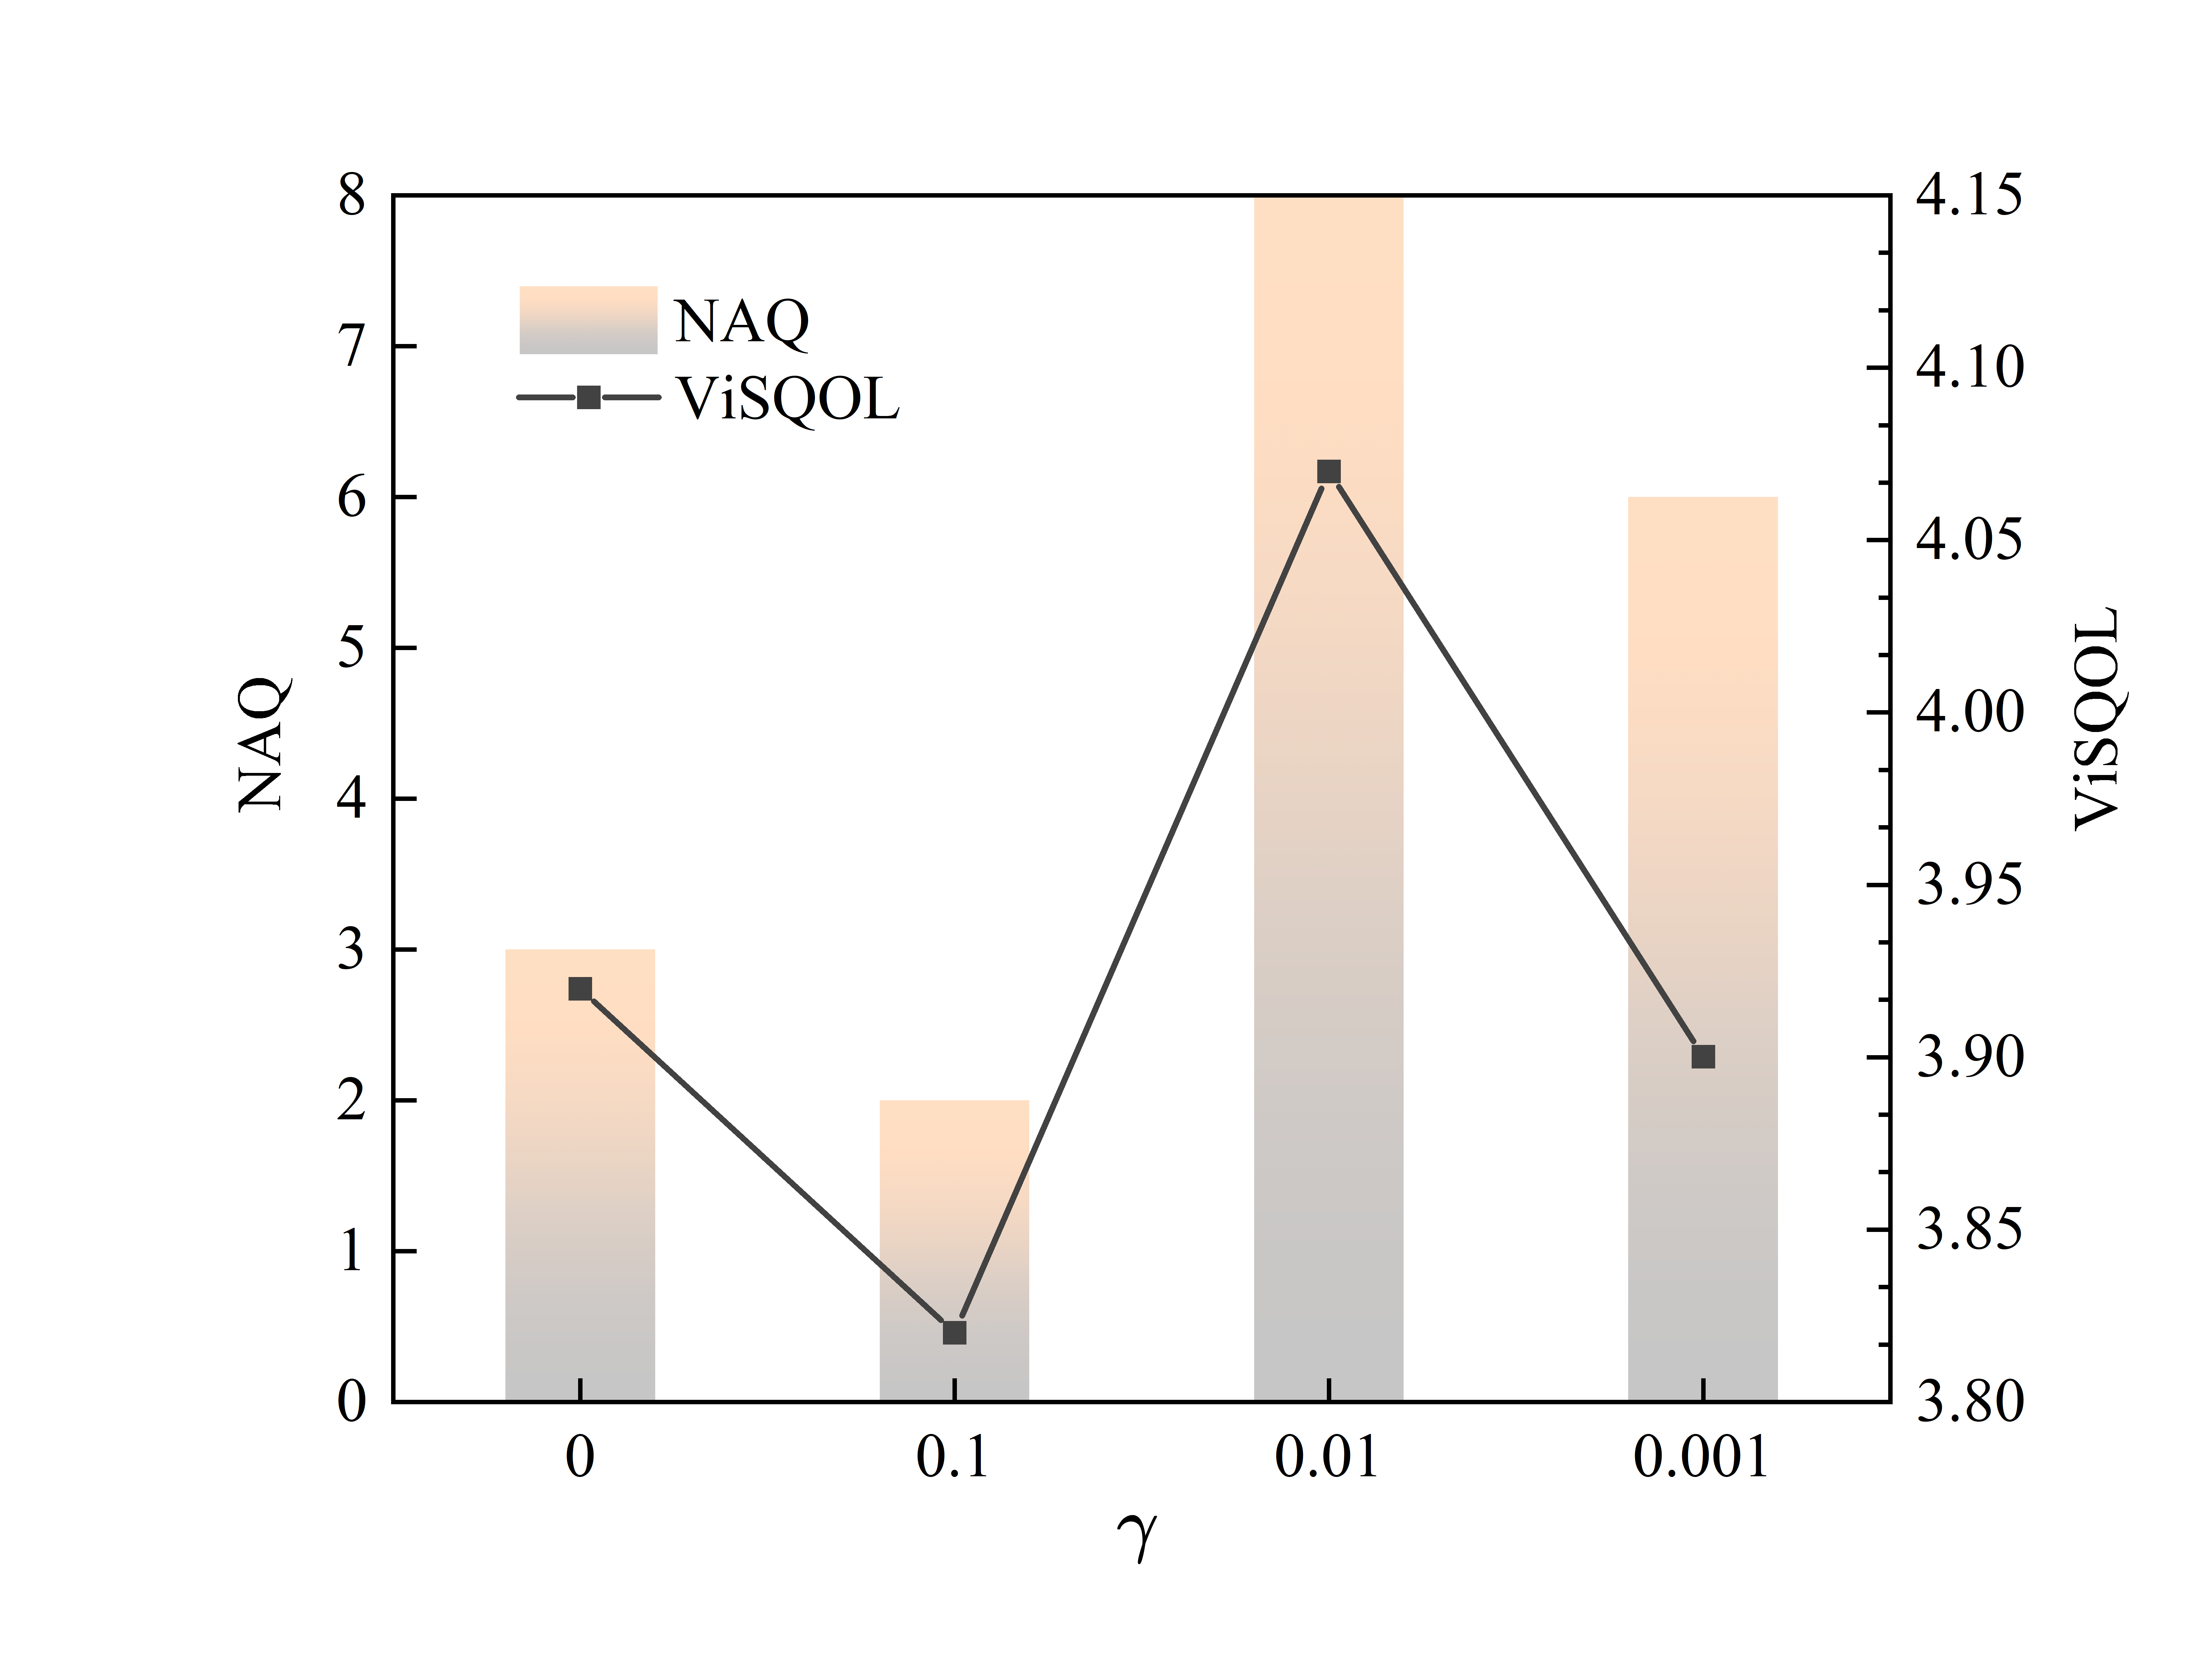
The chart compares two metrics (NAQ and ViSQOL) across four γ parameter values (0, 0.1, 0.01, 0.001). NAQ is represented by peach-colored bars, while ViSQOL is shown as a black line with square markers. The chart reveals inverse relationships between γ and the metrics at certain thresholds.
### Components/Axes
- **X-axis (γ)**: Discrete values [0, 0.1, 0.01, 0.001] (logarithmic spacing)
- **Left Y-axis (NAQ)**: Scale 0–8 (integer increments)
- **Right Y-axis (ViSQOL)**: Scale 3.80–4.15 (0.05 increments)
- **Legend**:
- NAQ: Peach-colored bars (top-left position)
- ViSQOL: Black line with square markers (top-left position)
### Detailed Analysis
**NAQ Bars**:
- γ=0: ~3.0
- γ=0.1: ~2.0
- γ=0.01: ~7.0 (peak)
- γ=0.001: ~6.0
**ViSQOL Line**:
- γ=0: 3.90
- γ=0.1: 3.85
- γ=0.01: 4.10 (peak)
- γ=0.001: 3.95
### Key Observations
1. **Peak Alignment**: Both metrics reach maximum values at γ=0.01 (NAQ=7.0, ViSQOL=4.10)
2. **Inverse Relationships**:
- At γ=0.1: NAQ (2.0) < ViSQOL (3.85)
- At γ=0.001: NAQ (6.0) > ViSQOL (3.95)
3. **Divergence at γ=0**: NAQ (3.0) > ViSQOL (3.90) despite lower γ value
4. **Non-linear Scaling**: ViSQOL shows smaller absolute changes (0.25 max) vs. NAQ (4.0 max)
### Interpretation
The data suggests γ=0.01 represents an optimal threshold where both metrics achieve their highest values. Below this threshold (γ=0.001), NAQ decreases more significantly than ViSQOL, indicating potential trade-offs between the metrics at extreme γ values. The inverse relationship at γ=0.1 suggests γ magnitude critically influences metric performance. This pattern could reflect a system where intermediate γ values balance competing objectives represented by NAQ and ViSQOL.