## Tree Diagram: Hierarchical Structure
### Overview
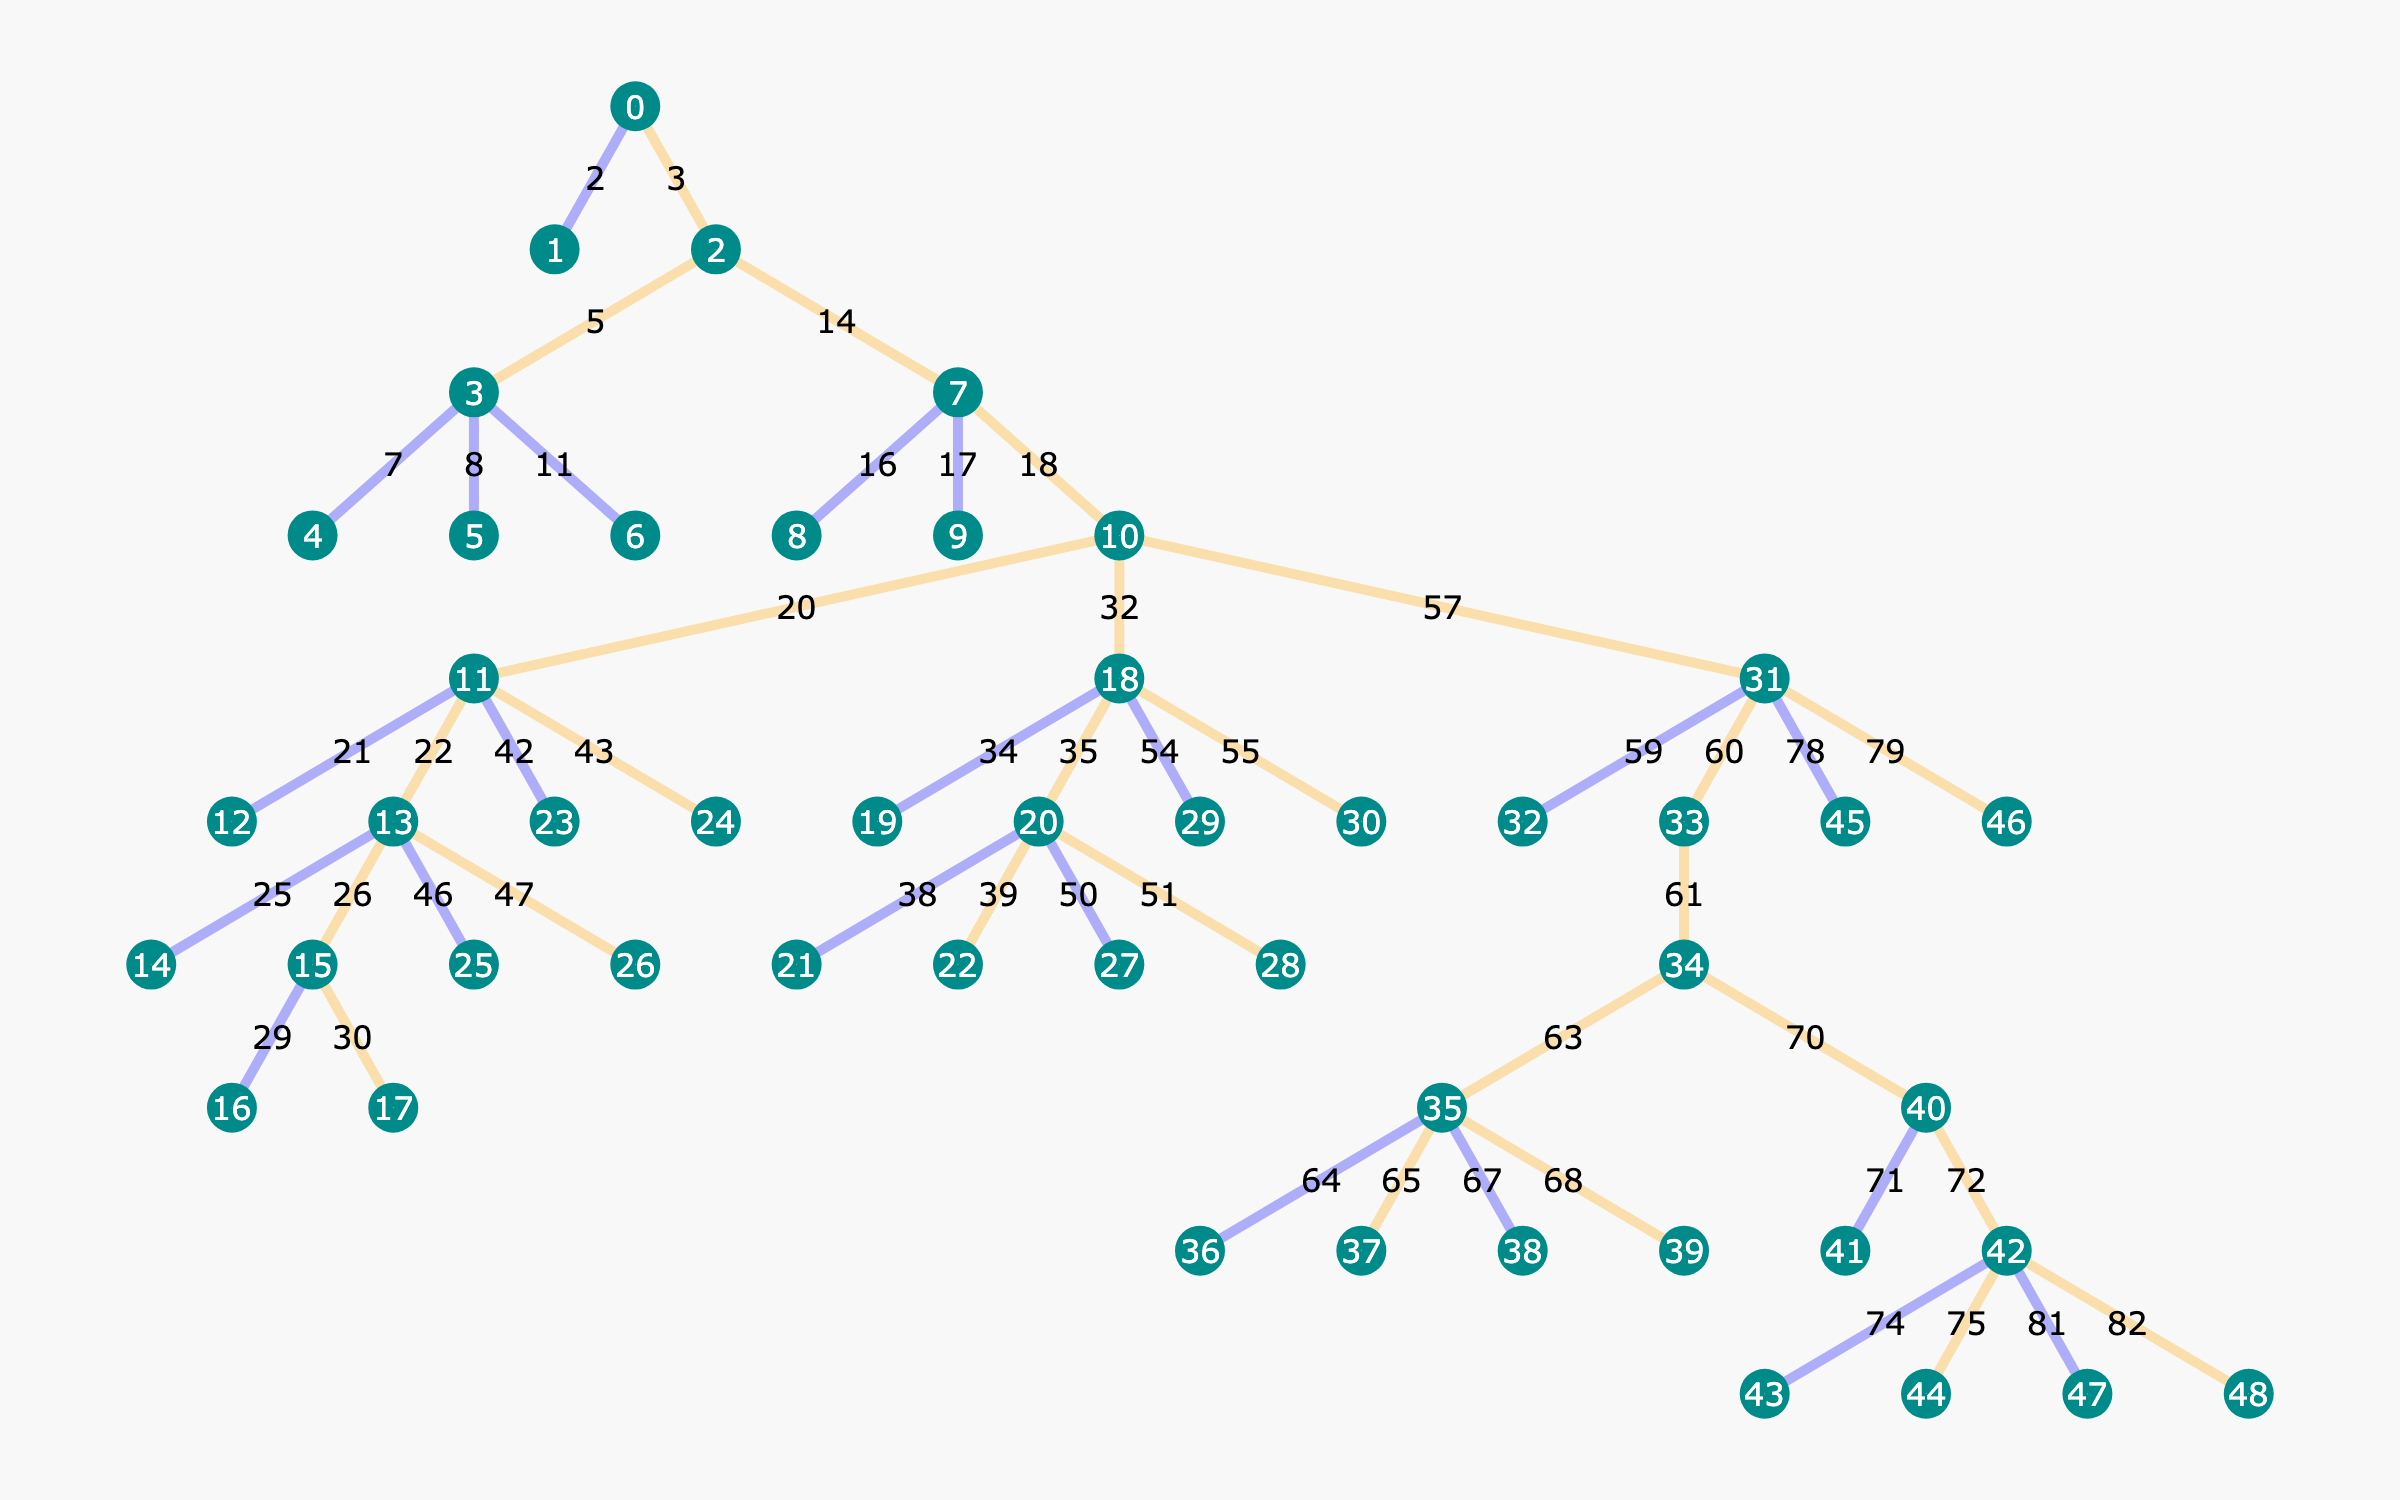
The image is a tree diagram illustrating a hierarchical structure. It consists of nodes (represented as teal circles with numbers inside) connected by lines (either light orange or light purple). The numbers on the nodes appear to represent levels or identifiers within the hierarchy. The numbers on the lines appear to represent weights or distances between the nodes.
### Components/Axes
* **Nodes:** Teal circles, each containing a unique number from 0 to 48. These represent individual elements within the hierarchical structure.
* **Edges:** Lines connecting the nodes, representing relationships between them. The edges are either light orange or light purple.
* **Edge Weights:** Numbers displayed along the edges, indicating the "cost" or "distance" between connected nodes.
### Detailed Analysis
Here's a breakdown of the connections and weights, tracing the tree from the root:
* **Node 0:** Top-center of the diagram.
* Connected to Node 1 (left) with weight 2 (light purple).
* Connected to Node 2 (right) with weight 3 (light orange).
* **Node 1:**
* Connected to Node 3 with weight 7 (light purple).
* **Node 2:**
* Connected to Node 7 with weight 14 (light orange).
* **Node 3:**
* Connected to Node 4 with weight 7 (light purple).
* Connected to Node 5 with weight 8 (light purple).
* Connected to Node 6 with weight 11 (light orange).
* **Node 7:**
* Connected to Node 8 with weight 16 (light purple).
* Connected to Node 9 with weight 17 (light purple).
* Connected to Node 10 with weight 18 (light orange).
* **Node 10:**
* Connected to Node 11 with weight 20 (light orange).
* Connected to Node 18 with weight 32 (light orange).
* Connected to Node 31 with weight 57 (light orange).
* **Node 11:**
* Connected to Node 12 with weight 21 (light purple).
* Connected to Node 13 with weight 22 (light purple).
* Connected to Node 23 with weight 42 (light orange).
* Connected to Node 24 with weight 43 (light orange).
* **Node 12:**
* Connected to Node 14 with weight 25 (light purple).
* **Node 13:**
* Connected to Node 15 with weight 26 (light purple).
* Connected to Node 25 with weight 46 (light orange).
* Connected to Node 26 with weight 47 (light orange).
* **Node 15:**
* Connected to Node 16 with weight 29 (light purple).
* Connected to Node 17 with weight 30 (light orange).
* **Node 18:**
* Connected to Node 19 with weight 34 (light purple).
* Connected to Node 20 with weight 35 (light purple).
* Connected to Node 29 with weight 54 (light orange).
* Connected to Node 30 with weight 55 (light orange).
* **Node 19:**
* Connected to Node 21 with weight 38 (light purple).
* Connected to Node 22 with weight 39 (light purple).
* **Node 31:**
* Connected to Node 32 with weight 59 (light purple).
* Connected to Node 33 with weight 60 (light purple).
* Connected to Node 45 with weight 78 (light orange).
* Connected to Node 46 with weight 79 (light orange).
* **Node 32:**
* No further connections.
* **Node 33:**
* Connected to Node 34 with weight 61 (light orange).
* **Node 34:**
* Connected to Node 35 with weight 63 (light orange).
* **Node 35:**
* Connected to Node 36 with weight 64 (light purple).
* Connected to Node 37 with weight 65 (light purple).
* Connected to Node 38 with weight 67 (light orange).
* Connected to Node 39 with weight 68 (light orange).
* **Node 40:**
* Connected to Node 41 with weight 70 (light orange).
* **Node 40:**
* Connected to Node 41 with weight 71 (light purple).
* Connected to Node 42 with weight 72 (light orange).
* **Node 41:**
* Connected to Node 43 with weight 74 (light purple).
* **Node 42:**
* Connected to Node 44 with weight 75 (light purple).
* Connected to Node 47 with weight 81 (light orange).
* Connected to Node 48 with weight 82 (light orange).
### Key Observations
* The tree structure is not perfectly balanced. Some branches are deeper than others.
* The edge weights vary significantly, suggesting different levels of "cost" or "distance" between nodes.
* The colors of the edges (light orange and light purple) might represent different types of relationships or categories, but this is not explicitly defined.
### Interpretation
The tree diagram visually represents a hierarchical relationship between different elements (nodes). The edge weights could represent the strength of the relationship, the cost of transitioning between elements, or some other relevant metric. The diagram could be used to model various systems, such as organizational structures, decision trees, or network topologies. Without further context, the specific meaning of the nodes, edges, and weights remains ambiguous. The two different colors of edges could represent different types of relationships, but this is not explicitly stated.