\n
## Network Diagram: Node-Link Visualization
### Overview
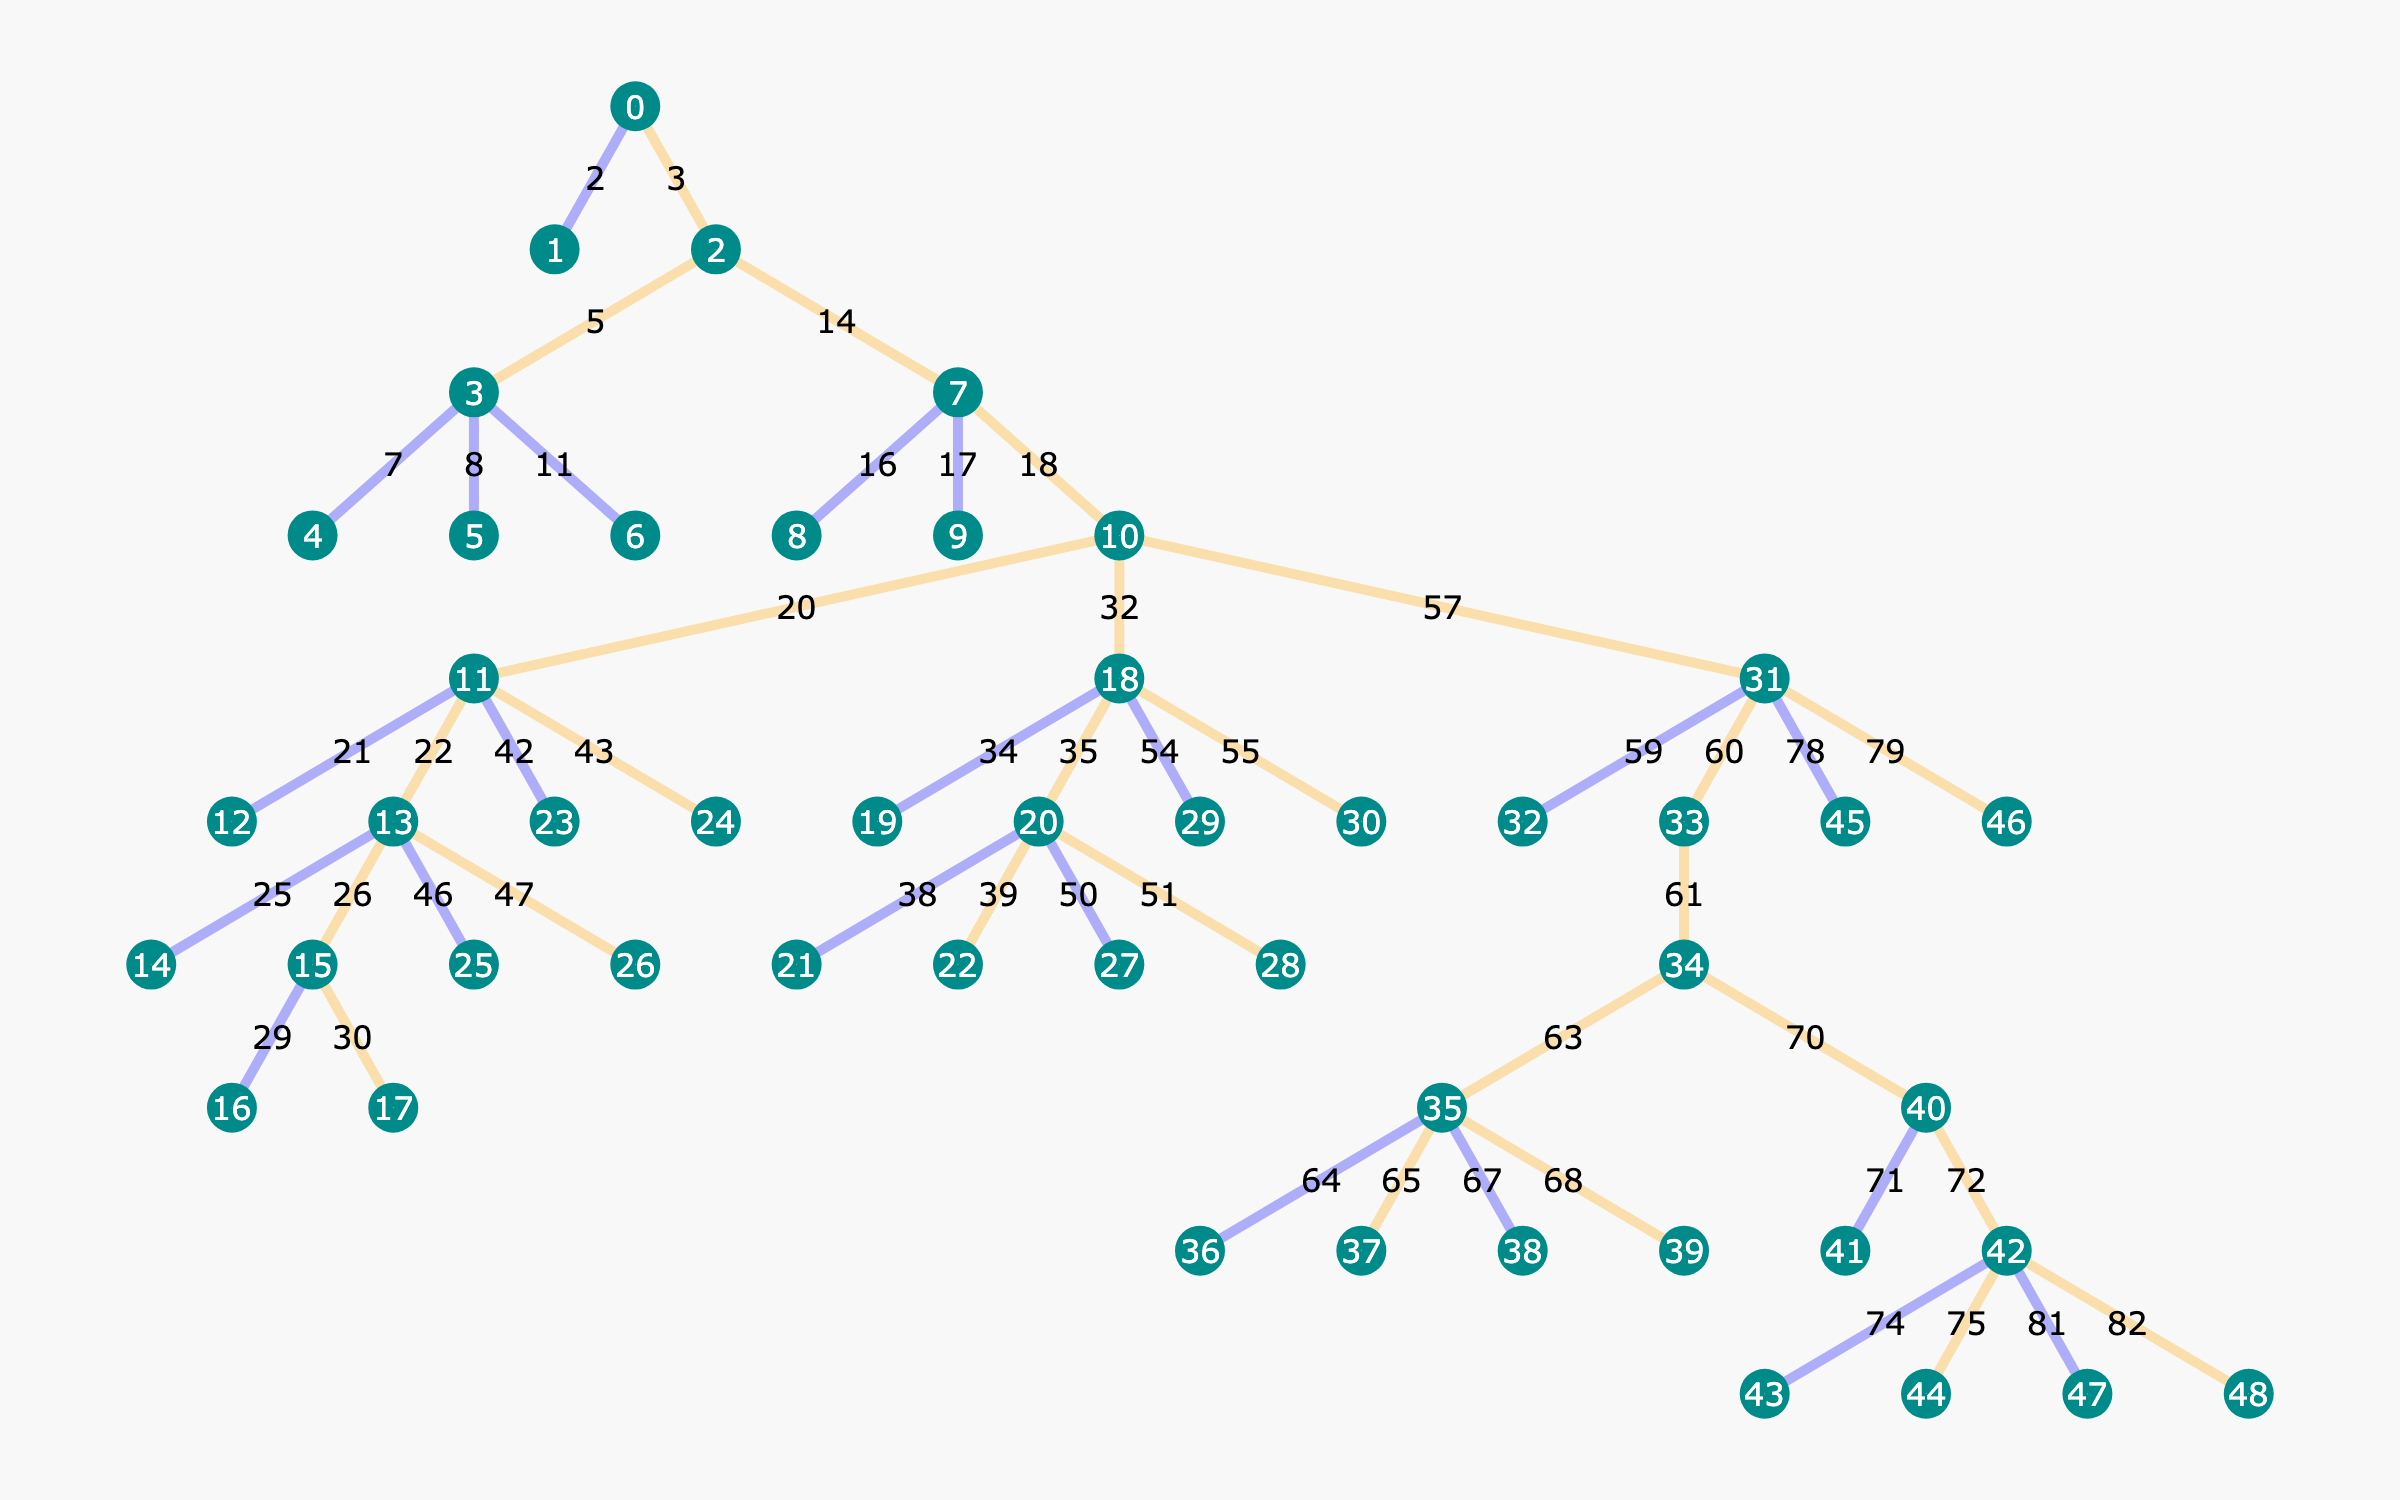
The image presents a network diagram consisting of nodes (numbered 0-48) connected by lines. The lines appear to represent relationships or connections between the nodes, and are colored in shades of yellow and teal. The nodes are arranged in a roughly triangular shape, with node 0 at the top and nodes 46-48 at the bottom-right. Each node is labeled with a number.
### Components/Axes
There are no explicit axes or scales in this diagram. The components are:
* **Nodes:** Represented by circles, labeled 0 through 48.
* **Edges/Links:** Represented by lines connecting the nodes. The lines are colored in two shades: a lighter yellow and a darker teal.
* **Node Labels:** Numerical identifiers for each node.
* **Edge Labels:** Numerical values associated with each line.
### Detailed Analysis or Content Details
The diagram contains 49 nodes and numerous edges. The edges are labeled with numerical values, presumably representing weights or distances.
Here's a breakdown of the connections and edge weights, proceeding roughly from top to bottom and left to right:
* 0-1: 2
* 0-2: 3
* 1-2: 14
* 1-3: 5
* 2-4: 7
* 2-5: 11
* 3-5: 8
* 3-6: 6
* 4-11: 21
* 4-12: 25
* 5-11: 22
* 5-13: 42
* 6-8: 16
* 6-9: 17
* 6-10: 20
* 7-9: 7
* 7-10: 18
* 8-19: 34
* 8-20: 35
* 9-18: 32
* 9-20: 54
* 10-18: 57
* 10-29: 55
* 11-13: 46
* 11-23: 43
* 12-16: 29
* 12-17: 30
* 13-17: 15
* 13-25: 26
* 14-16: 14
* 15-25: 47
* 16-17: 31
* 17-25: 33
* 18-19: 38
* 18-20: 39
* 18-27: 50
* 19-21: 21
* 19-22: 22
* 20-27: 51
* 20-28: 28
* 21-26: 26
* 22-27: 27
* 23-24: 43
* 24-26: 26
* 25-26: 26
* 27-35: 64
* 27-36: 65
* 28-35: 63
* 28-37: 66
* 29-30: 30
* 29-32: 59
* 30-32: 60
* 30-33: 61
* 31-33: 78
* 31-40: 70
* 32-34: 34
* 33-34: 79
* 33-45: 46
* 34-40: 71
* 34-41: 72
* 35-37: 67
* 35-38: 68
* 36-37: 65
* 36-39: 68
* 37-39: 68
* 38-41: 74
* 38-42: 75
* 39-41: 74
* 39-43: 44
* 40-42: 81
* 40-44: 75
* 41-42: 82
* 41-47: 47
* 42-48: 82
* 43-44: 44
* 44-47: 47
* 45-46: 46
The lines are colored teal for the connections between nodes 0-10 and yellow for the connections between nodes 11-48.
### Key Observations
* The network appears to be relatively dense in the lower-right quadrant (nodes 30-48).
* Node 18 has a high degree of connectivity, linking nodes 9, 19, 20, and 27.
* The edge weights vary considerably, suggesting different strengths of relationships between nodes.
* There is a clear visual separation based on edge color, potentially indicating different types of connections or phases of the network.
### Interpretation
This diagram likely represents a network of interconnected entities, where the nodes represent the entities and the edges represent relationships between them. The numerical labels on the edges could represent the strength, cost, or frequency of these relationships. The color-coding of the edges suggests a distinction between two phases or types of connections within the network.
The higher density of connections in the lower-right quadrant suggests that the entities in that region are more interconnected than those in the upper-left. Node 18 appears to be a central hub, playing a key role in connecting different parts of the network.
Without further context, it's difficult to determine the specific meaning of the network. However, the diagram provides a visual representation of the network's structure and relationships, which could be useful for analysis and understanding. The diagram could represent social networks, communication networks, transportation networks, or any other system where entities are connected by relationships. The two colors could represent different types of relationships, or perhaps the network's evolution over time.