## Line Graph: Accuracy vs. Thinking Compute
### Overview
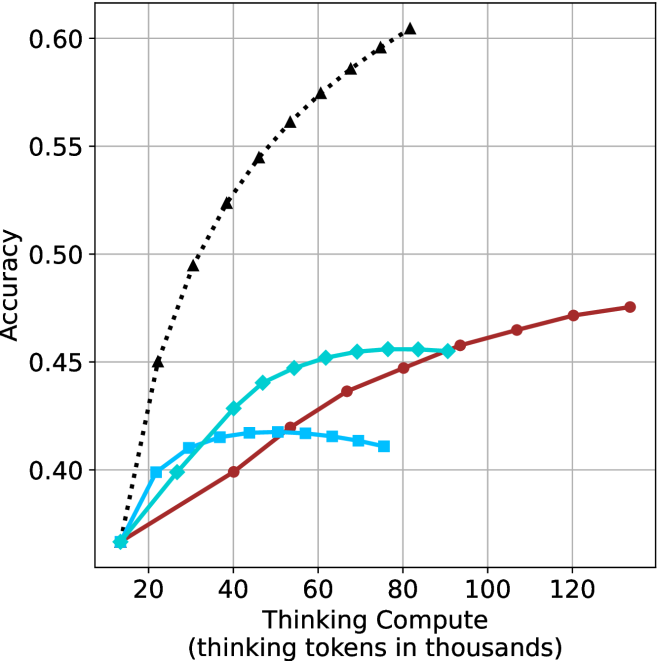
The graph illustrates the relationship between "Thinking Compute" (measured in thousands of thinking tokens) and "Accuracy" across three models (A, B, and C). Accuracy is plotted on the y-axis (0.35–0.60), while the x-axis ranges from 20 to 120 thousand tokens. Three distinct data series are represented by color-coded lines: black dotted (Model A), red solid (Model B), and blue dashed (Model C).
### Components/Axes
- **X-axis**: "Thinking Compute (thinking tokens in thousands)" with markers at 20, 40, 60, 80, 100, and 120.
- **Y-axis**: "Accuracy" scaled from 0.35 to 0.60 in increments of 0.05.
- **Legend**: Located in the top-right corner, associating:
- Black dotted line → Model A
- Red solid line → Model B
- Blue dashed line → Model C
### Detailed Analysis
1. **Model A (Black Dotted Line)**:
- Starts at ~0.45 accuracy at 20k tokens.
- Rises sharply to ~0.59 at 80k tokens.
- Declines slightly to ~0.57 at 120k tokens.
- Key data points: 20k (~0.45), 40k (~0.50), 60k (~0.55), 80k (~0.59), 100k (~0.58), 120k (~0.57).
2. **Model B (Red Solid Line)**:
- Begins at ~0.35 accuracy at 20k tokens.
- Increases steadily to ~0.48 at 120k tokens.
- Key data points: 20k (~0.35), 40k (~0.40), 60k (~0.43), 80k (~0.45), 100k (~0.47), 120k (~0.48).
3. **Model C (Blue Dashed Line)**:
- Starts at ~0.35 accuracy at 20k tokens.
- Peaks at ~0.45 at 60k tokens.
- Drops to ~0.42 at 80k tokens, then stabilizes at ~0.43 by 120k tokens.
- Key data points: 20k (~0.35), 40k (~0.42), 60k (~0.45), 80k (~0.42), 100k (~0.43), 120k (~0.43).
### Key Observations
- **Model A** exhibits the highest peak accuracy (~0.59) but shows a decline after 80k tokens, suggesting potential overfitting or diminishing returns.
- **Model B** demonstrates consistent, linear improvement in accuracy with increased compute, indicating efficient scaling.
- **Model C** shows a notable dip in accuracy at 80k tokens (~0.42), followed by stabilization, hinting at possible inefficiencies or resource constraints.
### Interpretation
The data suggests that **Model A** achieves the highest accuracy but may suffer from overfitting or inefficiency at higher compute levels. **Model B** balances compute and accuracy effectively, showing steady gains without significant drops. **Model C**’s dip at 80k tokens raises questions about its optimization or resource allocation. The trends highlight trade-offs between compute investment and performance, with Model B emerging as the most reliable performer across the tested range.