\n
## Chart: Similarity Score vs. Radius
### Overview
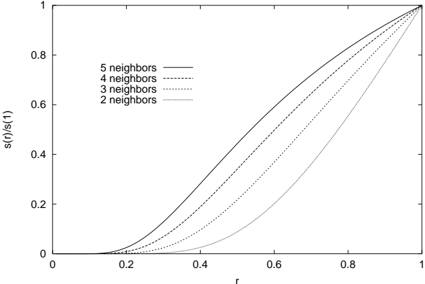
The image presents a line chart illustrating the relationship between a similarity score (normalized) and a radius 'r'. The chart compares this relationship for different numbers of neighbors used in a calculation, ranging from 2 to 5. The y-axis represents the normalized similarity score s(r)/s(1), and the x-axis represents the radius 'r'.
### Components/Axes
* **X-axis Label:** r
* **Y-axis Label:** s(r)/s(1)
* **X-axis Scale:** Ranges from approximately 0 to 1, with tick marks at 0.2, 0.4, 0.6, 0.8, and 1.
* **Y-axis Scale:** Ranges from approximately 0 to 1, with tick marks at 0, 0.2, 0.4, 0.6, 0.8, and 1.
* **Legend:** Located in the top-left corner, listing the following lines and their corresponding number of neighbors:
* "5 neighbors" - Solid black line
* "4 neighbors" - Dotted black line
* "3 neighbors" - Dashed black line
* "2 neighbors" - Light gray solid line
### Detailed Analysis
The chart displays four curves, each representing a different number of neighbors.
* **5 Neighbors (Solid Black Line):** This line starts at approximately (0, 0) and exhibits a slow, gradual increase until r = 0.4, where it begins to curve more steeply. At r = 0.6, the value is approximately 0.5. At r = 0.8, the value is approximately 0.8. It approaches 1 as r approaches 1.
* **4 Neighbors (Dotted Black Line):** This line also starts near (0, 0) and increases more rapidly than the 5 neighbors line. At r = 0.4, the value is approximately 0.3. At r = 0.6, the value is approximately 0.65. At r = 0.8, the value is approximately 0.9. It approaches 1 as r approaches 1.
* **3 Neighbors (Dashed Black Line):** This line shows an even faster increase than the 4 neighbors line. At r = 0.4, the value is approximately 0.45. At r = 0.6, the value is approximately 0.8. At r = 0.8, the value is approximately 0.95. It approaches 1 as r approaches 1.
* **2 Neighbors (Light Gray Solid Line):** This line exhibits the most rapid increase. At r = 0.4, the value is approximately 0.6. At r = 0.6, the value is approximately 0.9. At r = 0.8, the value is approximately 0.99. It approaches 1 as r approaches 1.
All lines converge towards a value of 1 as 'r' approaches 1.
### Key Observations
* As the number of neighbors decreases, the similarity score increases more rapidly with increasing radius 'r'.
* The curves demonstrate a non-linear relationship between the similarity score and the radius.
* The 2-neighbor curve reaches a similarity score close to 1 at a lower radius compared to the other curves.
### Interpretation
This chart likely represents the performance of a neighborhood-based similarity metric. The 'radius' 'r' could represent a distance threshold, and the similarity score s(r)/s(1) indicates the degree of similarity between data points within that radius. The number of neighbors used in the calculation influences how quickly the similarity score increases with radius.
A smaller number of neighbors (e.g., 2) leads to a faster increase in similarity, suggesting that even a small radius captures a significant portion of similar data points. Conversely, a larger number of neighbors (e.g., 5) results in a slower increase, indicating that a larger radius is needed to achieve the same level of similarity.
The convergence of all lines to 1 as 'r' approaches 1 suggests that at a sufficiently large radius, all data points are considered similar, regardless of the number of neighbors used. This could be due to the metric becoming saturated or the entire dataset being considered as a single neighborhood. The choice of the number of neighbors is a trade-off between sensitivity to local variations and robustness to noise.