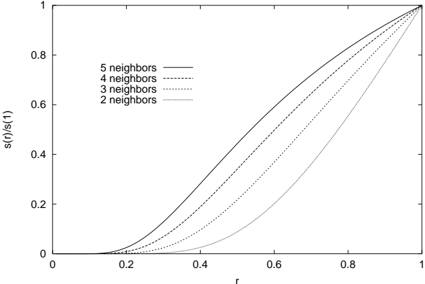
## Line Graph: Relationship Between s(r)/s(1) and r for Different Neighbor Counts
### Overview
The image depicts a line graph illustrating the relationship between the normalized variable **s(r)/s(1)** (y-axis) and the parameter **r** (x-axis), both ranging from 0 to 1. Four distinct curves represent systems with varying numbers of neighbors (2, 3, 4, and 5), differentiated by line styles. All curves originate at the origin (0,0) and converge at (1,1), with steeper slopes corresponding to higher neighbor counts.
### Components/Axes
- **X-axis (r)**: Labeled "r", scaled from 0 to 1 in increments of 0.2.
- **Y-axis (s(r)/s(1))**: Labeled "s(r)/s(1)", scaled from 0 to 1 in increments of 0.2.
- **Legend**: Positioned in the top-left corner, associating line styles with neighbor counts:
- **Solid black**: 5 neighbors
- **Dotted black**: 4 neighbors
- **Dashed black**: 3 neighbors
- **Dash-dotted black**: 2 neighbors
### Detailed Analysis
1. **5 neighbors (solid black)**:
- Steepest slope, consistently above other curves.
- At r = 0.5, s(r)/s(1) ≈ 0.75.
- At r = 0.8, s(r)/s(1) ≈ 0.92.
2. **4 neighbors (dotted black)**:
- Slightly less steep than 5 neighbors.
- At r = 0.5, s(r)/s(1) ≈ 0.68.
- At r = 0.8, s(r)/s(1) ≈ 0.85.
3. **3 neighbors (dashed black)**:
- Gradual curve, intermediate slope.
- At r = 0.5, s(r)/s(1) ≈ 0.55.
- At r = 0.8, s(r)/s(1) ≈ 0.78.
4. **2 neighbors (dash-dotted black)**:
- Flattest slope, closest to the x-axis.
- At r = 0.5, s(r)/s(1) ≈ 0.42.
- At r = 0.8, s(r)/s(1) ≈ 0.65.
### Key Observations
- All curves share identical endpoints (0,0) and (1,1), indicating a universal scaling behavior at extremes.
- The slope of each curve increases with the number of neighbors, suggesting a direct correlation between neighbor count and the sensitivity of **s(r)/s(1)** to changes in **r**.
- The 2-neighbor curve exhibits the most gradual increase, while the 5-neighbor curve shows the sharpest rise.
### Interpretation
The graph demonstrates that systems with more neighbors exhibit a stronger dependence of **s(r)/s(1)** on **r**, likely reflecting enhanced connectivity or interaction effects in the modeled system. This could imply:
- **Percolation thresholds**: Higher neighbor counts may lower critical thresholds for phase transitions.
- **Network robustness**: Increased neighbors could correlate with greater system resilience or information propagation efficiency.
- **Scaling laws**: The convergence at (1,1) suggests a universal upper bound for **s(r)/s(1)** regardless of neighbor count.
No outliers or anomalies are present; the trends align with expected monotonic relationships. The absence of error bars or confidence intervals limits quantitative certainty, but the qualitative pattern is clear.