## Line Chart: Cumulative solving + checking time
### Overview
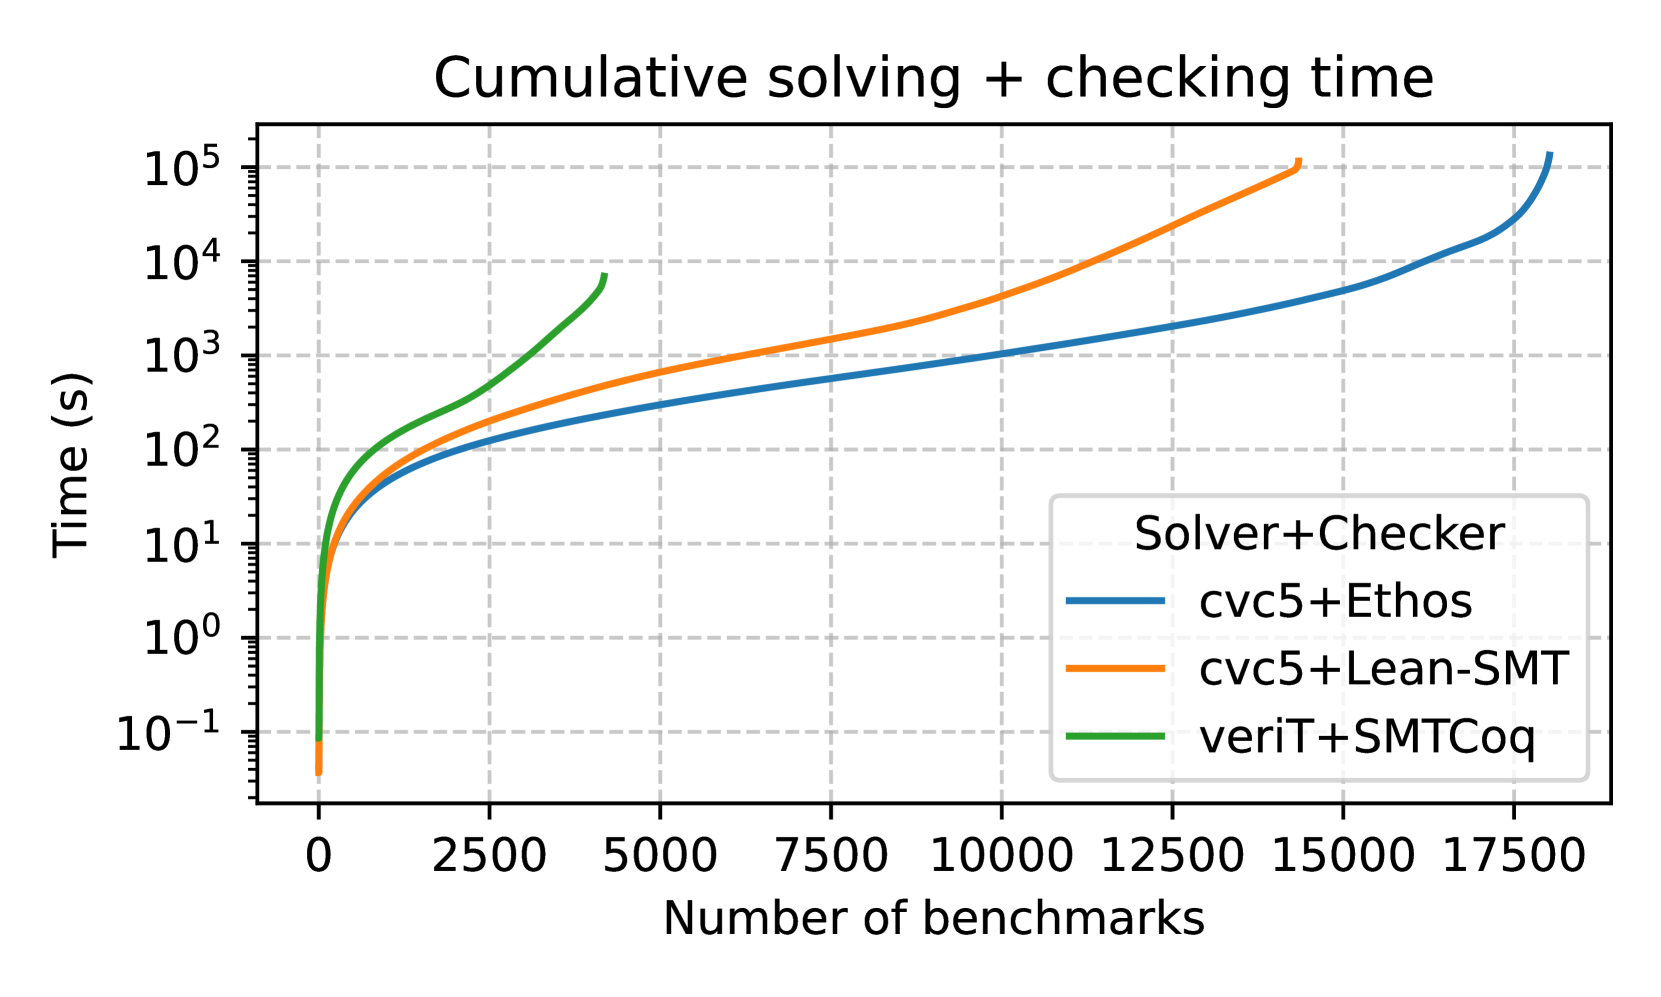
The image is a line chart comparing the cumulative solving and checking time for three different solver-checker combinations: cvc5+Ethos, cvc5+Lean-SMT, and veriT+SMTCoq. The x-axis represents the number of benchmarks, and the y-axis represents the time in seconds on a logarithmic scale.
### Components/Axes
* **Title:** Cumulative solving + checking time
* **X-axis:**
* Label: Number of benchmarks
* Scale: Linear, ranging from 0 to 17500, with tick marks at intervals of 2500.
* **Y-axis:**
* Label: Time (s)
* Scale: Logarithmic (base 10), ranging from 10^-1 to 10^5. Tick marks are present at each power of 10.
* **Legend (located in the bottom-right corner):**
* Solver+Checker
* Blue line: cvc5+Ethos
* Orange line: cvc5+Lean-SMT
* Green line: veriT+SMTCoq
### Detailed Analysis
* **cvc5+Ethos (Blue line):**
* Trend: The line starts relatively flat, then begins to increase more sharply around 12500 benchmarks, and increases rapidly towards the end.
* Data Points:
* At 0 benchmarks, the time is approximately 0.1 s.
* At 5000 benchmarks, the time is approximately 50 s.
* At 10000 benchmarks, the time is approximately 150 s.
* At 15000 benchmarks, the time is approximately 5000 s.
* At 17500 benchmarks, the time is approximately 100000 s.
* **cvc5+Lean-SMT (Orange line):**
* Trend: The line increases steadily, but the rate of increase is not constant.
* Data Points:
* At 0 benchmarks, the time is approximately 0.05 s.
* At 5000 benchmarks, the time is approximately 80 s.
* At 10000 benchmarks, the time is approximately 500 s.
* At 15000 benchmarks, the time is approximately 20000 s.
* **veriT+SMTCoq (Green line):**
* Trend: The line increases sharply initially, then plateaus, and then increases sharply again.
* Data Points:
* At 0 benchmarks, the time is approximately 0.05 s.
* At 2500 benchmarks, the time is approximately 50 s.
* At 5000 benchmarks, the time is approximately 500 s.
### Key Observations
* The veriT+SMTCoq combination initially performs similarly to the other two, but its performance plateaus after 2500 benchmarks.
* The cvc5+Ethos combination shows a significant increase in solving time towards the end of the benchmark set.
* The cvc5+Lean-SMT combination shows a more consistent increase in solving time across the benchmark set.
### Interpretation
The chart compares the performance of three different solver-checker combinations on a set of benchmarks. The cumulative solving and checking time provides insight into the overall efficiency of each combination. The logarithmic scale on the y-axis allows for easy comparison of performance across a wide range of times. The data suggests that the choice of solver-checker combination can significantly impact the time required to solve and check a given set of benchmarks. The veriT+SMTCoq combination seems to struggle with larger benchmark sets, while the cvc5+Ethos combination experiences a performance bottleneck towards the end. The cvc5+Lean-SMT combination appears to offer a more balanced performance across the entire benchmark set.