## Line Chart: Cumulative solving + checking time
### Overview
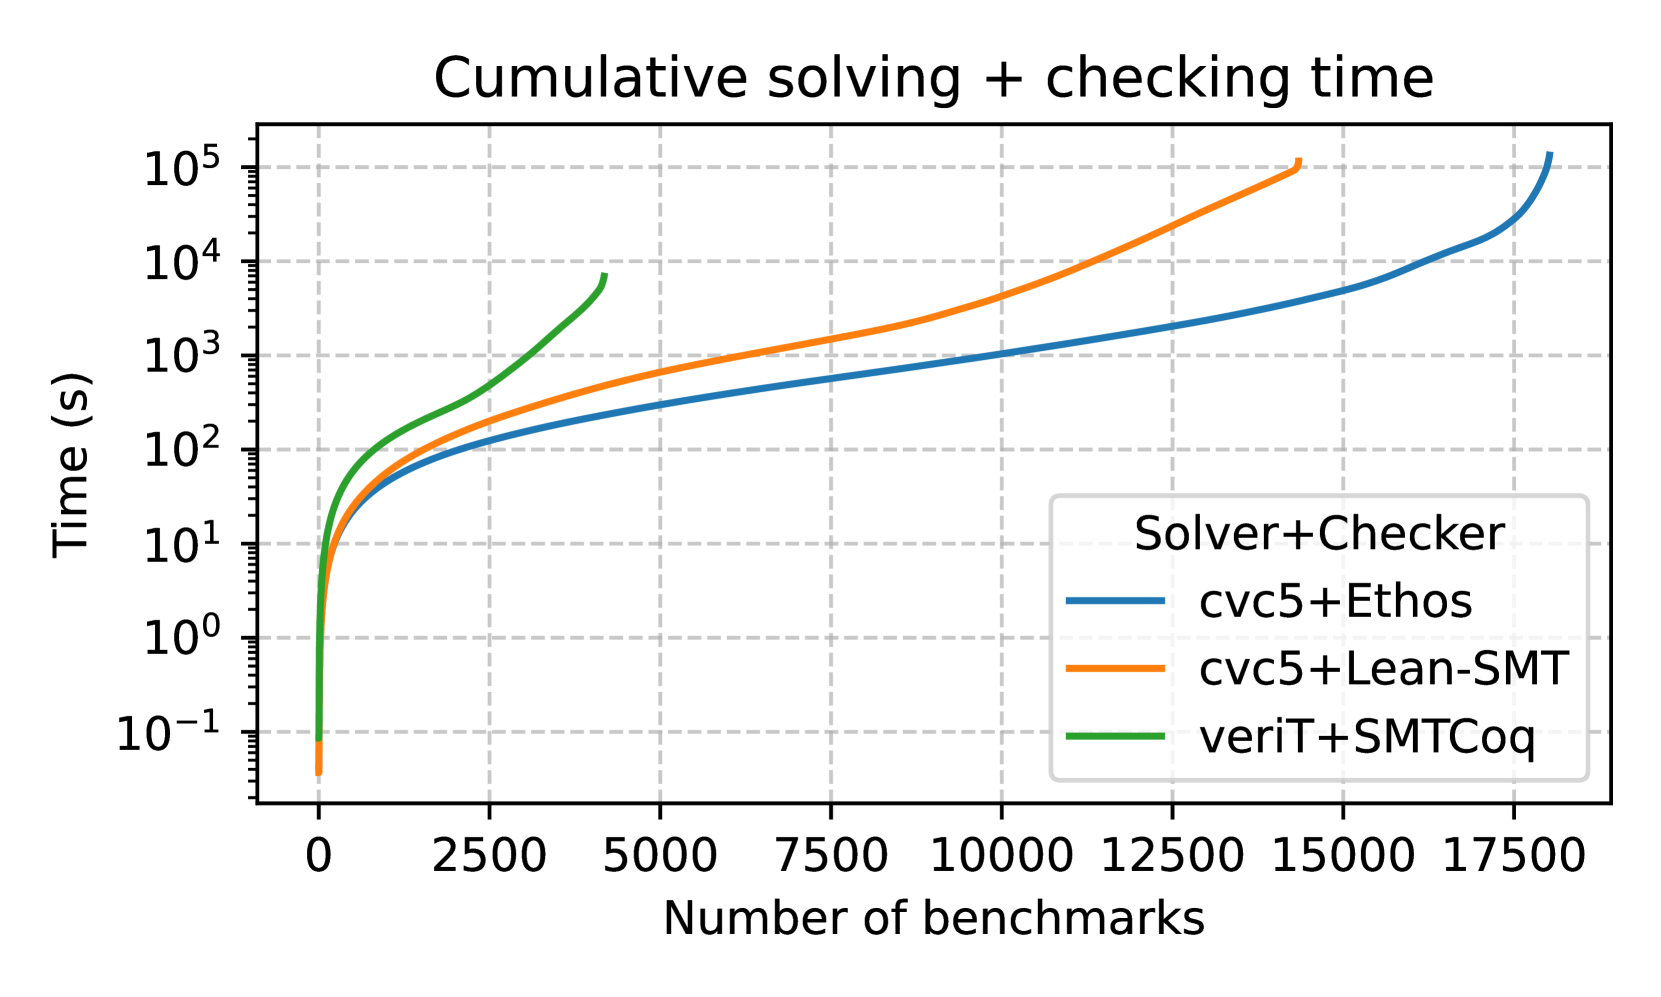
The image presents a line chart illustrating the cumulative solving and checking time for three different solver/checker combinations as a function of the number of benchmarks processed. The y-axis represents time in seconds (logarithmic scale), and the x-axis represents the number of benchmarks.
### Components/Axes
* **Title:** "Cumulative solving + checking time" (centered at the top)
* **X-axis Label:** "Number of benchmarks" (bottom-center)
* **Y-axis Label:** "Time (s)" (left-center, logarithmic scale)
* **Legend:** Located in the bottom-right corner, listing the solver/checker combinations:
* cvc5+Ethos (Blue line)
* cvc5+Lean-SMT (Orange line)
* veriT+SMTCog (Green line)
* **Gridlines:** Present on a logarithmic scale for the y-axis and linear for the x-axis.
* **Y-axis Scale:** Logarithmic, with markers at 10<sup>-1</sup>, 10<sup>0</sup>, 10<sup>1</sup>, 10<sup>2</sup>, 10<sup>3</sup>, 10<sup>4</sup>, 10<sup>5</sup>.
* **X-axis Scale:** Linear, with markers at 0, 2500, 5000, 7500, 10000, 12500, 15000, 17500.
### Detailed Analysis
* **cvc5+Ethos (Blue Line):** The blue line starts at approximately 0.1 seconds at 0 benchmarks and increases relatively slowly initially. It then exhibits a steeper increase between 2500 and 7500 benchmarks, reaching approximately 200 seconds at 7500 benchmarks. The line continues to increase, reaching approximately 5000 seconds at 17500 benchmarks. The trend is generally upward, but the rate of increase slows down at higher benchmark counts.
* **cvc5+Lean-SMT (Orange Line):** The orange line starts at approximately 0.1 seconds at 0 benchmarks. It increases more rapidly than the blue line initially, reaching approximately 100 seconds at 2500 benchmarks. The line continues to increase at a relatively consistent rate, reaching approximately 2000 seconds at 7500 benchmarks and approximately 50000 seconds at 17500 benchmarks. The trend is consistently upward.
* **veriT+SMTCog (Green Line):** The green line starts at approximately 0.1 seconds at 0 benchmarks. It increases rapidly initially, surpassing both the blue and orange lines. It reaches approximately 1000 seconds at 5000 benchmarks and approximately 2000 seconds at 7500 benchmarks. The line continues to increase, reaching approximately 10000 seconds at 15000 benchmarks and approximately 20000 seconds at 17500 benchmarks. The trend is consistently upward, but the rate of increase appears to slow down slightly at higher benchmark counts.
### Key Observations
* The `cvc5+Lean-SMT` solver/checker combination consistently exhibits the highest cumulative solving and checking time across all benchmark counts.
* The `cvc5+Ethos` solver/checker combination consistently exhibits the lowest cumulative solving and checking time, especially at lower benchmark counts.
* The `veriT+SMTCog` solver/checker combination starts with a rapid increase in time, but its growth rate appears to slow down at higher benchmark counts, eventually falling between the other two.
* All three solver/checker combinations demonstrate a non-linear relationship between the number of benchmarks and the cumulative solving and checking time, likely due to the increasing complexity of the benchmarks as the number increases.
### Interpretation
The chart demonstrates the scalability of different solver/checker combinations when processing a growing number of benchmarks. The logarithmic y-axis highlights the exponential growth in solving time as the number of benchmarks increases. The `cvc5+Lean-SMT` combination, while potentially efficient for smaller sets of benchmarks, appears to struggle with scalability, exhibiting the highest cumulative time for larger sets. The `cvc5+Ethos` combination appears to be the most scalable, maintaining the lowest cumulative time throughout the range of benchmarks tested. The `veriT+SMTCog` combination shows an intermediate performance, with an initial rapid increase in time followed by a slower growth rate.
The differences in performance likely stem from the underlying algorithms and optimization strategies employed by each solver and checker. The chart suggests that choosing the appropriate solver/checker combination is crucial for efficiently processing large numbers of benchmarks. The observed trends could be used to inform the selection of solvers/checkers based on the expected size of the benchmark set. The logarithmic scale is important to note, as it compresses the differences in time at higher values, potentially obscuring the true magnitude of the performance differences.