## Line Graph: Cumulative solving + checking time
### Overview
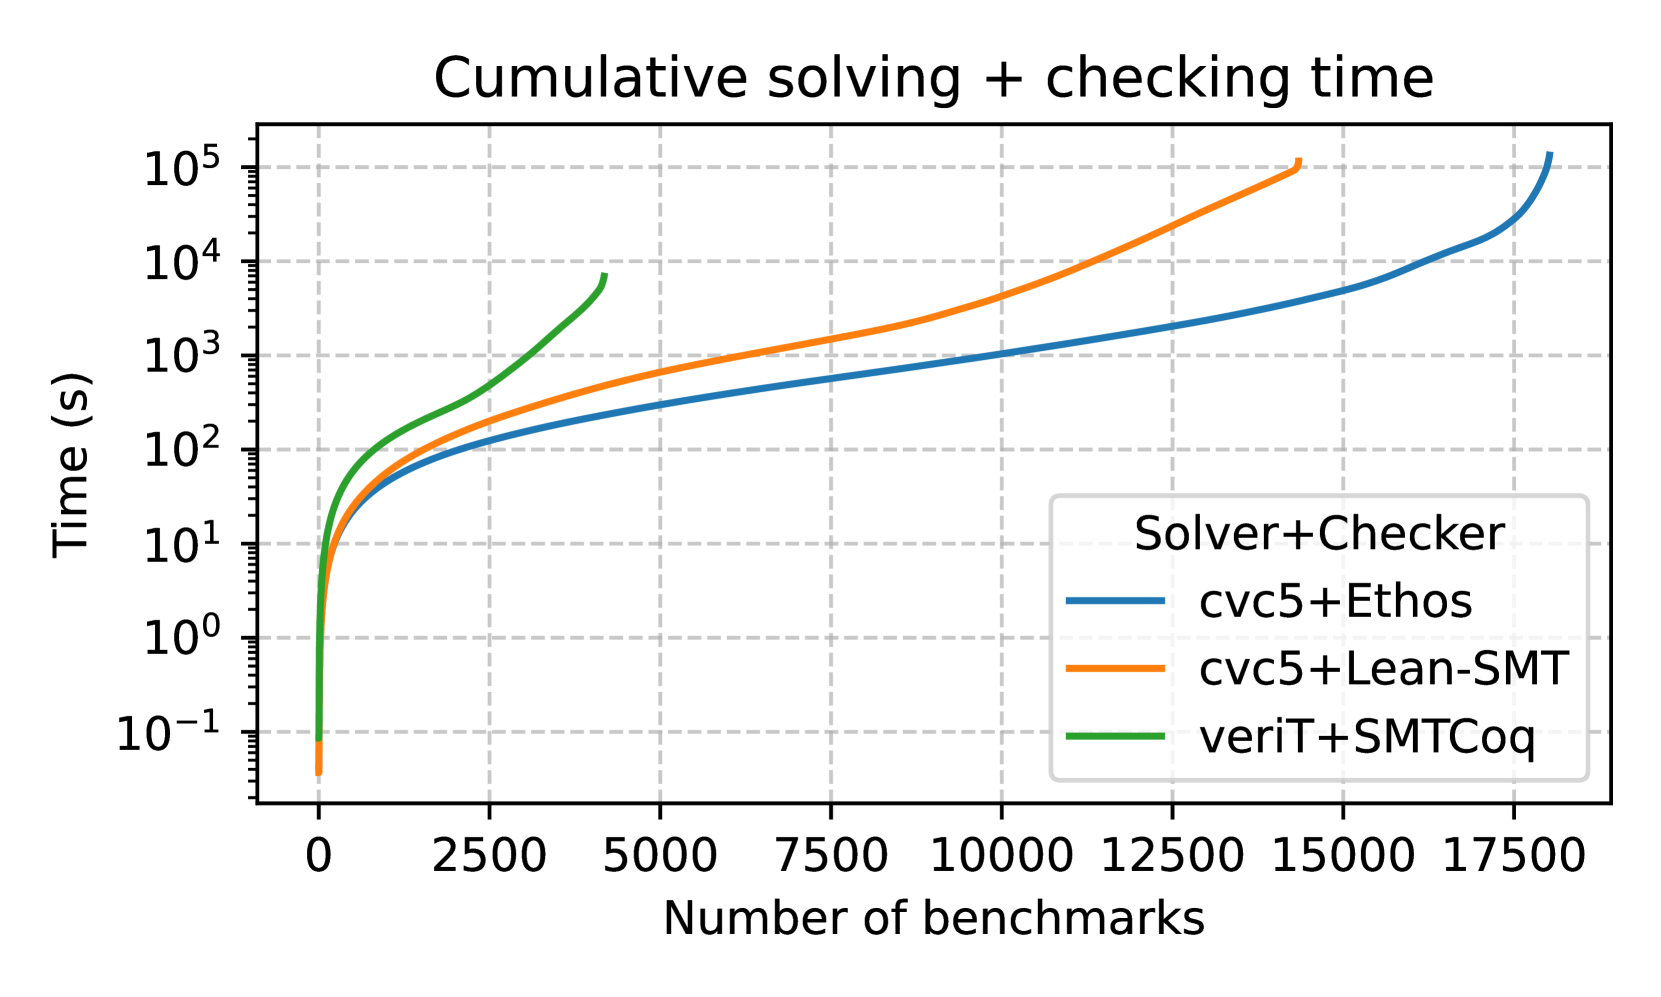
The graph depicts the cumulative time (in seconds) required for three solver-checker combinations as the number of benchmarks increases. The y-axis uses a logarithmic scale (10^-1 to 10^5), while the x-axis ranges from 0 to 17,500 benchmarks. Three distinct lines represent different solver-checker pairs, with varying growth rates over the benchmark range.
### Components/Axes
- **X-axis**: "Number of benchmarks" (0–17,500, linear scale)
- **Y-axis**: "Time (s)" (10^-1 to 10^5, logarithmic scale)
- **Legend**:
- Blue line: "cvc5+Ethos"
- Orange line: "cvc5+Lean-SMT"
- Green line: "veriT+SMTCoq"
- **Grid**: Dashed gray lines for reference
### Detailed Analysis
1. **veriT+SMTCoq (Green line)**:
- Starts steeply, reaching ~10^3 seconds at ~2,500 benchmarks.
- Plateaus abruptly after ~2,500 benchmarks, remaining near 10^3 seconds.
- No further growth observed beyond this point.
2. **cvc5+Ethos (Blue line)**:
- Gradual, linear growth from ~10^0 to ~10^4 seconds.
- At 17,500 benchmarks, time reaches ~10^5 seconds.
- Slope remains consistent throughout the range.
3. **cvc5+Lean-SMT (Orange line)**:
- Steeper than the blue line, with exponential growth.
- At 10,000 benchmarks, time reaches ~10^4 seconds.
- By 17,500 benchmarks, time exceeds ~10^5 seconds.
- Sharp inflection point observed after ~10,000 benchmarks.
### Key Observations
- The green line ("veriT+SMTCoq") exhibits a **hard performance cap** at ~2,500 benchmarks, suggesting algorithmic limitations or resource constraints.
- The orange line ("cvc5+Lean-SMT") demonstrates **superlinear scaling**, with time increasing disproportionately as benchmarks grow.
- The blue line ("cvc5+Ethos") shows **linear scalability**, maintaining a predictable time increase.
- All lines originate at the same point (0 benchmarks, 10^-1 seconds), indicating baseline initialization time.
### Interpretation
The data highlights critical differences in solver-checker efficiency:
1. **veriT+SMTCoq** is optimal for small-scale problems (<2,500 benchmarks) but fails to scale, likely due to fixed computational resources or algorithmic bottlenecks.
2. **cvc5+Lean-SMT** struggles with large datasets, as its time complexity grows faster than the input size, suggesting suboptimal optimization for high-volume benchmarks.
3. **cvc5+Ethos** offers the most balanced performance, maintaining linear scalability across the entire benchmark range. This implies better resource management or algorithmic adaptability.
The logarithmic y-axis emphasizes exponential time differences, particularly for the orange line, which becomes impractical for large-scale use. The green line's plateau raises questions about whether it represents a true performance limit or measurement artifact. These trends underscore the importance of selecting solver-checker pairs based on problem scale and resource availability.