## Line Chart: Accuracy vs. Sample Size
### Overview
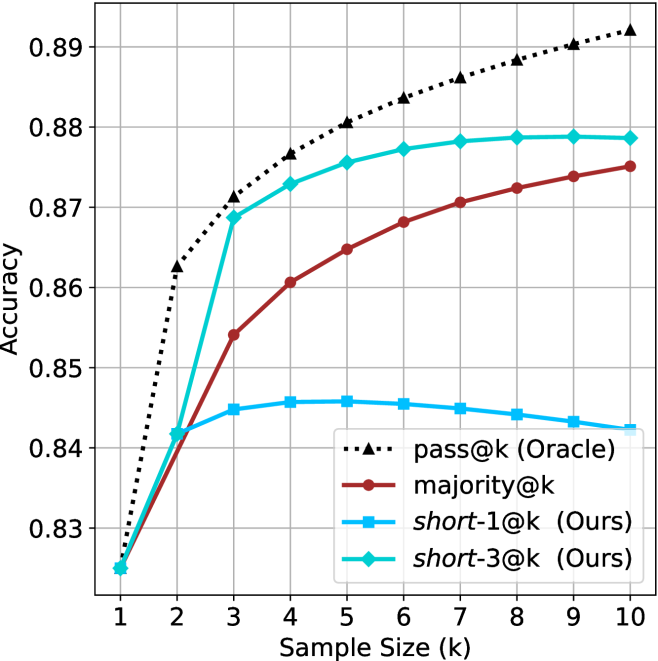
This image presents a line chart illustrating the relationship between accuracy and sample size (k) for four different methods: pass@k (Oracle), majority@k, short-1@k (Ours), and short-3@k (Ours). The chart displays how accuracy changes as the sample size increases from 1 to 10.
### Components/Axes
* **X-axis:** "Sample Size (k)" ranging from 1 to 10. The axis is labeled and has tick marks at integer values.
* **Y-axis:** "Accuracy" ranging from 0.83 to 0.89. The axis is labeled and has tick marks at 0.83, 0.84, 0.85, 0.86, 0.87, 0.88, and 0.89.
* **Legend:** Located in the bottom-right corner of the chart. It identifies the four data series:
* pass@k (Oracle) - represented by a black dotted line.
* majority@k - represented by a brown solid line.
* short-1@k (Ours) - represented by a blue solid line.
* short-3@k (Ours) - represented by a teal solid line.
* **Gridlines:** A light gray grid is present to aid in reading values.
### Detailed Analysis
Here's a breakdown of each line's trend and approximate data points:
* **pass@k (Oracle):** (Black dotted line) This line exhibits a steep upward slope, indicating a rapid increase in accuracy with increasing sample size.
* k=1: Accuracy ≈ 0.825
* k=2: Accuracy ≈ 0.865
* k=3: Accuracy ≈ 0.875
* k=4: Accuracy ≈ 0.88
* k=10: Accuracy ≈ 0.89
* **majority@k:** (Brown solid line) This line shows a moderate upward slope, with the rate of increase slowing down as the sample size grows.
* k=1: Accuracy ≈ 0.83
* k=2: Accuracy ≈ 0.86
* k=3: Accuracy ≈ 0.87
* k=4: Accuracy ≈ 0.873
* k=10: Accuracy ≈ 0.875
* **short-1@k (Ours):** (Blue solid line) This line initially increases rapidly, then plateaus.
* k=1: Accuracy ≈ 0.83
* k=2: Accuracy ≈ 0.845
* k=3: Accuracy ≈ 0.85
* k=4: Accuracy ≈ 0.85
* k=10: Accuracy ≈ 0.85
* **short-3@k (Ours):** (Teal solid line) This line shows a consistent upward trend, but less steep than pass@k.
* k=1: Accuracy ≈ 0.83
* k=2: Accuracy ≈ 0.85
* k=3: Accuracy ≈ 0.865
* k=4: Accuracy ≈ 0.875
* k=10: Accuracy ≈ 0.88
### Key Observations
* The "pass@k (Oracle)" method consistently achieves the highest accuracy across all sample sizes.
* The "majority@k" method shows a steady increase in accuracy, but plateaus at a lower level than "pass@k (Oracle)".
* "short-1@k (Ours)" has the lowest accuracy and plateaus quickly.
* "short-3@k (Ours)" performs better than "short-1@k (Ours)" and shows a more consistent improvement with increasing sample size.
* All methods show diminishing returns in accuracy as the sample size increases beyond k=4.
### Interpretation
The chart demonstrates the performance of different methods for a task where accuracy is measured. The "pass@k (Oracle)" method, likely representing an ideal or upper-bound scenario, serves as a benchmark. The "majority@k" method provides a reasonable level of accuracy, while the "short-1@k (Ours)" and "short-3@k (Ours)" methods represent proposed approaches ("Ours").
The fact that "short-3@k (Ours)" outperforms "short-1@k (Ours)" suggests that increasing the number of samples considered (from 1 to 3) improves the accuracy of the proposed method. However, none of the "Ours" methods reach the performance of the "Oracle" or "majority@k" methods. The plateauing of all lines indicates that there's a limit to the accuracy achievable with this approach, even with larger sample sizes. This could be due to inherent limitations in the method itself or the nature of the data. The diminishing returns suggest that beyond a certain sample size, the effort to collect more data does not yield significant improvements in accuracy.