## Line Chart: Accuracy vs. Sample Size (k)
### Overview
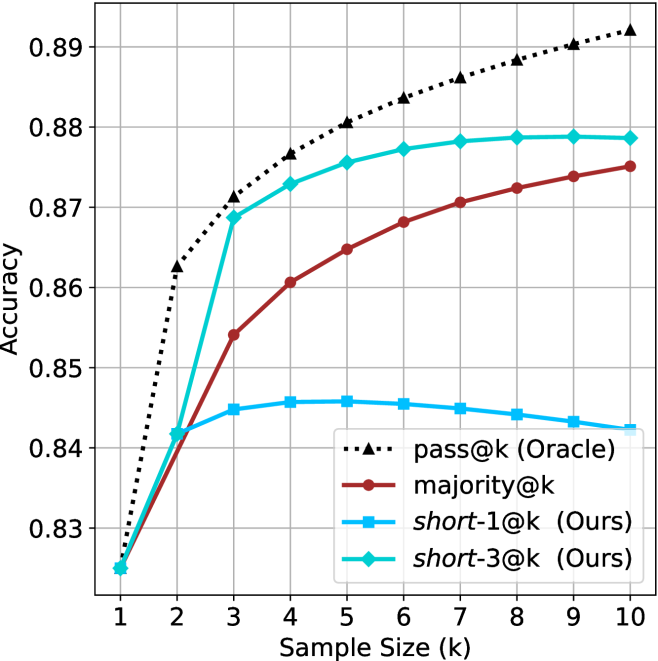
The image is a line chart comparing the performance (accuracy) of four different methods as the sample size (k) increases from 1 to 10. The chart demonstrates how accuracy scales with more samples for an oracle method, a majority voting baseline, and two variants of a proposed method ("Ours").
### Components/Axes
* **Chart Type:** Line chart with markers.
* **X-Axis:**
* **Label:** `Sample Size (k)`
* **Scale:** Linear, integer values from 1 to 10.
* **Tick Marks:** 1, 2, 3, 4, 5, 6, 7, 8, 9, 10.
* **Y-Axis:**
* **Label:** `Accuracy`
* **Scale:** Linear, ranging from approximately 0.825 to 0.895.
* **Tick Marks:** 0.83, 0.84, 0.85, 0.86, 0.87, 0.88, 0.89.
* **Legend:** Located in the bottom-right quadrant of the chart area. It contains four entries:
1. `pass@k (Oracle)`: Black dotted line with upward-pointing triangle markers.
2. `majority@k`: Dark red solid line with circle markers.
3. `short-1@k (Ours)`: Blue solid line with square markers.
4. `short-3@k (Ours)`: Cyan solid line with diamond markers.
* **Grid:** A light gray grid is present, aiding in value estimation.
### Detailed Analysis
**Data Series Trends & Approximate Values:**
| k | pass@k (Oracle) | short-3@k (Ours) | majority@k | short-1@k (Ours) |
|---|-----------------|------------------|------------|------------------|
| 1 | ~0.825 | ~0.825 | ~0.825 | ~0.825 |
| 2 | ~0.862 | ~0.842 | ~0.842 | ~0.842 |
| 3 | ~0.871 | ~0.868 | ~0.854 | ~0.845 |
| 4 | ~0.877 | ~0.873 | ~0.861 | ~0.846 |
| 5 | ~0.881 | ~0.876 | ~0.865 | ~0.846 |
| 6 | ~0.884 | ~0.877 | ~0.868 | ~0.845 |
| 7 | ~0.886 | ~0.878 | ~0.871 | ~0.845 |
| 8 | ~0.888 | ~0.879 | ~0.873 | ~0.844 |
| 9 | ~0.890 | ~0.879 | ~0.874 | ~0.843 |
| 10| ~0.892 | ~0.879 | ~0.875 | ~0.842 |
**Trend Descriptions:**
1. **pass@k (Oracle) [Black, Dotted, Triangles]:**
* **Trend:** Shows a strong, steady logarithmic-like increase. It is the top-performing series for all k > 1.
2. **short-3@k (Ours) [Cyan, Solid, Diamonds]:**
* **Trend:** Increases rapidly from k=1 to k=3, then continues to increase at a decelerating rate, plateauing near k=8-10. It is the second-best performing series.
3. **majority@k [Dark Red, Solid, Circles]:**
* **Trend:** Shows a steady, near-linear increase across all sample sizes. It consistently performs below `short-3@k` but above `short-1@k` for k > 2.
4. **short-1@k (Ours) [Blue, Solid, Squares]:**
* **Trend:** Increases from k=1 to k=4, peaks around k=4-5, and then shows a slight but consistent decline as k increases further. It is the lowest-performing series for k > 2.
### Key Observations
1. **Convergence at k=1:** All four methods start at the same accuracy point (~0.825) when the sample size is 1.
2. **Performance Hierarchy:** A clear and consistent hierarchy is established for k > 1: `pass@k (Oracle)` > `short-3@k (Ours)` > `majority@k` > `short-1@k (Ours)`.
3. **Diminishing Returns:** All curves show diminishing returns; the gain in accuracy per additional sample decreases as k grows. This is most pronounced for `short-3@k` and `pass@k`.
4. **Anomalous Trend:** The `short-1@k` series exhibits a unique trend where performance peaks early (k=4-5) and then degrades slightly with more samples, unlike the other methods which never decrease.
### Interpretation
The chart presents a comparative analysis of sampling-based methods, likely for a task like code generation or classification where multiple attempts ("samples") are made and aggregated.
* **Oracle as Upper Bound:** The `pass@k (Oracle)` line represents an idealized upper bound, where the correct answer is counted if it appears in any of the k samples. Its steady climb shows that simply having more "chances" reliably improves the chance of success.
* **Efficacy of Proposed Method:** The `short-3@k (Ours)` method significantly outperforms the standard `majority@k` voting baseline. This suggests that the authors' technique for selecting or aggregating from 3 short samples is more effective than simple majority voting over k samples.
* **Limitation of Single Short Sample:** The poor and declining performance of `short-1@k` indicates that relying on a single short sample does not scale well. The slight decline could suggest that as k increases, the method might be selecting less optimal samples or that the aggregation rule for a single short sample is not robust to larger pools.
* **Practical Implication:** For a practitioner, this chart argues that using the authors' `short-3` method with a moderate sample size (e.g., k=5-7) offers a strong balance between performance and computational cost, achieving accuracy close to the oracle's trajectory without requiring an excessive number of samples. The data underscores that more samples are beneficial, but the method of using them is critical.