## Line Graph: Accuracy vs. Sample Size (k)
### Overview
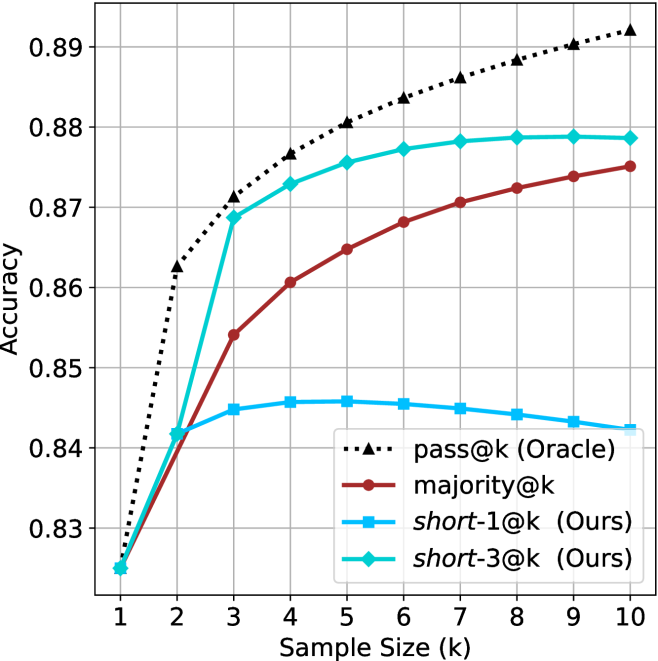
The image is a line graph comparing the accuracy of four different methods across varying sample sizes (k = 1 to 10). The y-axis represents accuracy (ranging from 0.83 to 0.89), and the x-axis represents sample size (k). Four data series are plotted, each with distinct markers and colors, as defined in the legend.
### Components/Axes
- **X-axis (Sample Size, k)**: Labeled "Sample Size (k)" with integer values from 1 to 10.
- **Y-axis (Accuracy)**: Labeled "Accuracy" with values from 0.83 to 0.89.
- **Legend**: Located in the bottom-right corner, with four entries:
- **pass@k (Oracle)**: Black dotted line with triangle markers.
- **majority@k**: Red solid line with circle markers.
- **short-1@k (Ours)**: Blue solid line with square markers.
- **short-3@k (Ours)**: Green solid line with diamond markers.
### Detailed Analysis
#### pass@k (Oracle)
- **Trend**: Starts at 0.83 (k=1) and increases steadily to 0.89 (k=10).
- **Data Points**:
- k=1: 0.83
- k=2: 0.86
- k=3: 0.87
- k=4: 0.875
- k=5: 0.88
- k=6: 0.885
- k=7: 0.887
- k=8: 0.888
- k=9: 0.889
- k=10: 0.89
#### majority@k
- **Trend**: Starts at 0.83 (k=1) and increases gradually to 0.88 (k=10).
- **Data Points**:
- k=1: 0.83
- k=2: 0.85
- k=3: 0.86
- k=4: 0.865
- k=5: 0.87
- k=6: 0.875
- k=7: 0.877
- k=8: 0.878
- k=9: 0.879
- k=10: 0.88
#### short-1@k (Ours)
- **Trend**: Starts at 0.83 (k=1), peaks at 0.845 (k=3), then declines slightly.
- **Data Points**:
- k=1: 0.83
- k=2: 0.84
- k=3: 0.845
- k=4: 0.845
- k=5: 0.845
- k=6: 0.845
- k=7: 0.844
- k=8: 0.843
- k=9: 0.842
- k=10: 0.841
#### short-3@k (Ours)
- **Trend**: Starts at 0.83 (k=1), rises sharply to 0.875 (k=3), then plateaus.
- **Data Points**:
- k=1: 0.83
- k=2: 0.86
- k=3: 0.875
- k=4: 0.875
- k=5: 0.875
- k=6: 0.875
- k=7: 0.875
- k=8: 0.875
- k=9: 0.875
- k=10: 0.875
### Key Observations
1. **pass@k (Oracle)** consistently achieves the highest accuracy, increasing linearly with sample size.
2. **majority@k** shows a steady improvement but lags behind the oracle, suggesting it is a baseline method.
3. **short-1@k** peaks at k=3 (0.845) and then declines, indicating potential overfitting or diminishing returns.
4. **short-3@k** achieves the highest accuracy among the proposed methods, matching the oracle's performance at k=3 and maintaining it for larger k.
### Interpretation
The graph demonstrates that the proposed methods (**short-1@k** and **short-3@k**) outperform the majority baseline, with **short-3@k** being particularly effective. The oracle (**pass@k**) represents the theoretical upper bound, and the proposed methods approach this bound as sample size increases. Notably, **short-3@k** achieves near-oracle performance even at small sample sizes (k=3), suggesting it is robust to limited data. The decline in **short-1@k** after k=3 highlights the importance of method design in balancing accuracy and scalability. This analysis underscores the value of the proposed methods in scenarios where sample size is constrained.