## Bar Chart: NMSE Comparison Across Model Configurations
### Overview
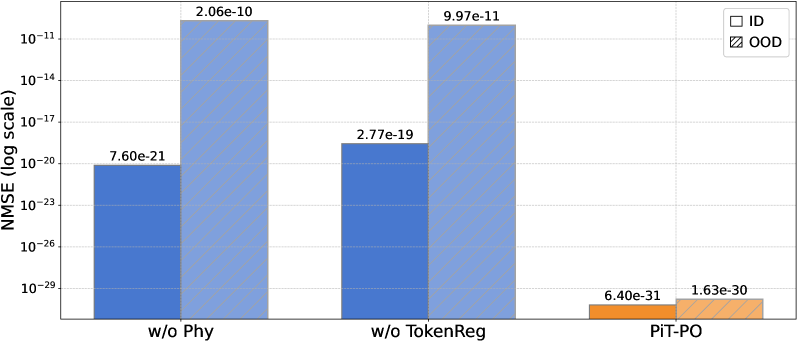
The chart compares Normalized Mean Squared Error (NMSE) values across three model configurations ("w/o Phy", "w/o TokenReg", "PiT-PO") for two data types: In-Distribution (ID) and Out-Of-Distribution (OOD). The y-axis uses a logarithmic scale from 10⁻²⁹ to 10⁻¹¹.
### Components/Axes
- **X-axis**: Model configurations
- "w/o Phy" (no physics component)
- "w/o TokenReg" (no token regularization)
- "PiT-PO" (full model)
- **Y-axis**: NMSE values (log scale)
- **Legend**:
- ID (solid blue)
- OOD (striped blue)
- **Bar Colors**:
- ID: Solid blue
- OOD: Striped blue
### Detailed Analysis
1. **w/o Phy**
- ID: 7.60e-21
- OOD: 2.06e-10
2. **w/o TokenReg**
- ID: 2.77e-19
- OOD: 9.97e-11
3. **PiT-PO**
- ID: 6.40e-31
- OOD: 1.63e-30
### Key Observations
- OOD NMSE values are consistently **10⁻¹⁰ to 10⁻¹¹** higher than ID values in "w/o Phy" and "w/o TokenReg" configurations.
- In "PiT-PO", both ID and OOD NMSE values drop to **~10⁻³⁰**, with OOD slightly higher (1.63e-30 vs 6.40e-31).
- The largest performance gap between ID and OOD occurs in the "w/o Phy" configuration (2.06e-10 vs 7.60e-21).
### Interpretation
The data demonstrates:
1. **Model Robustness**: The full "PiT-PO" model achieves near-identical performance on ID and OOD data (~10⁻³⁰ NMSE), suggesting strong generalization.
2. **Component Sensitivity**: Removing physics ("w/o Phy") causes the largest ID-OOD performance gap (10¹¹ difference in NMSE), indicating physics components are critical for generalization.
3. **Regularization Impact**: Token regularization ("w/o TokenReg") reduces but doesn't eliminate the ID-OOD gap (10⁸ difference).
4. **Scale Significance**: All NMSE values are <10⁻¹⁰, suggesting the model operates in a highly precise regime.
The logarithmic scale emphasizes multiplicative differences rather than absolute values, highlighting the exponential performance disparities between configurations.