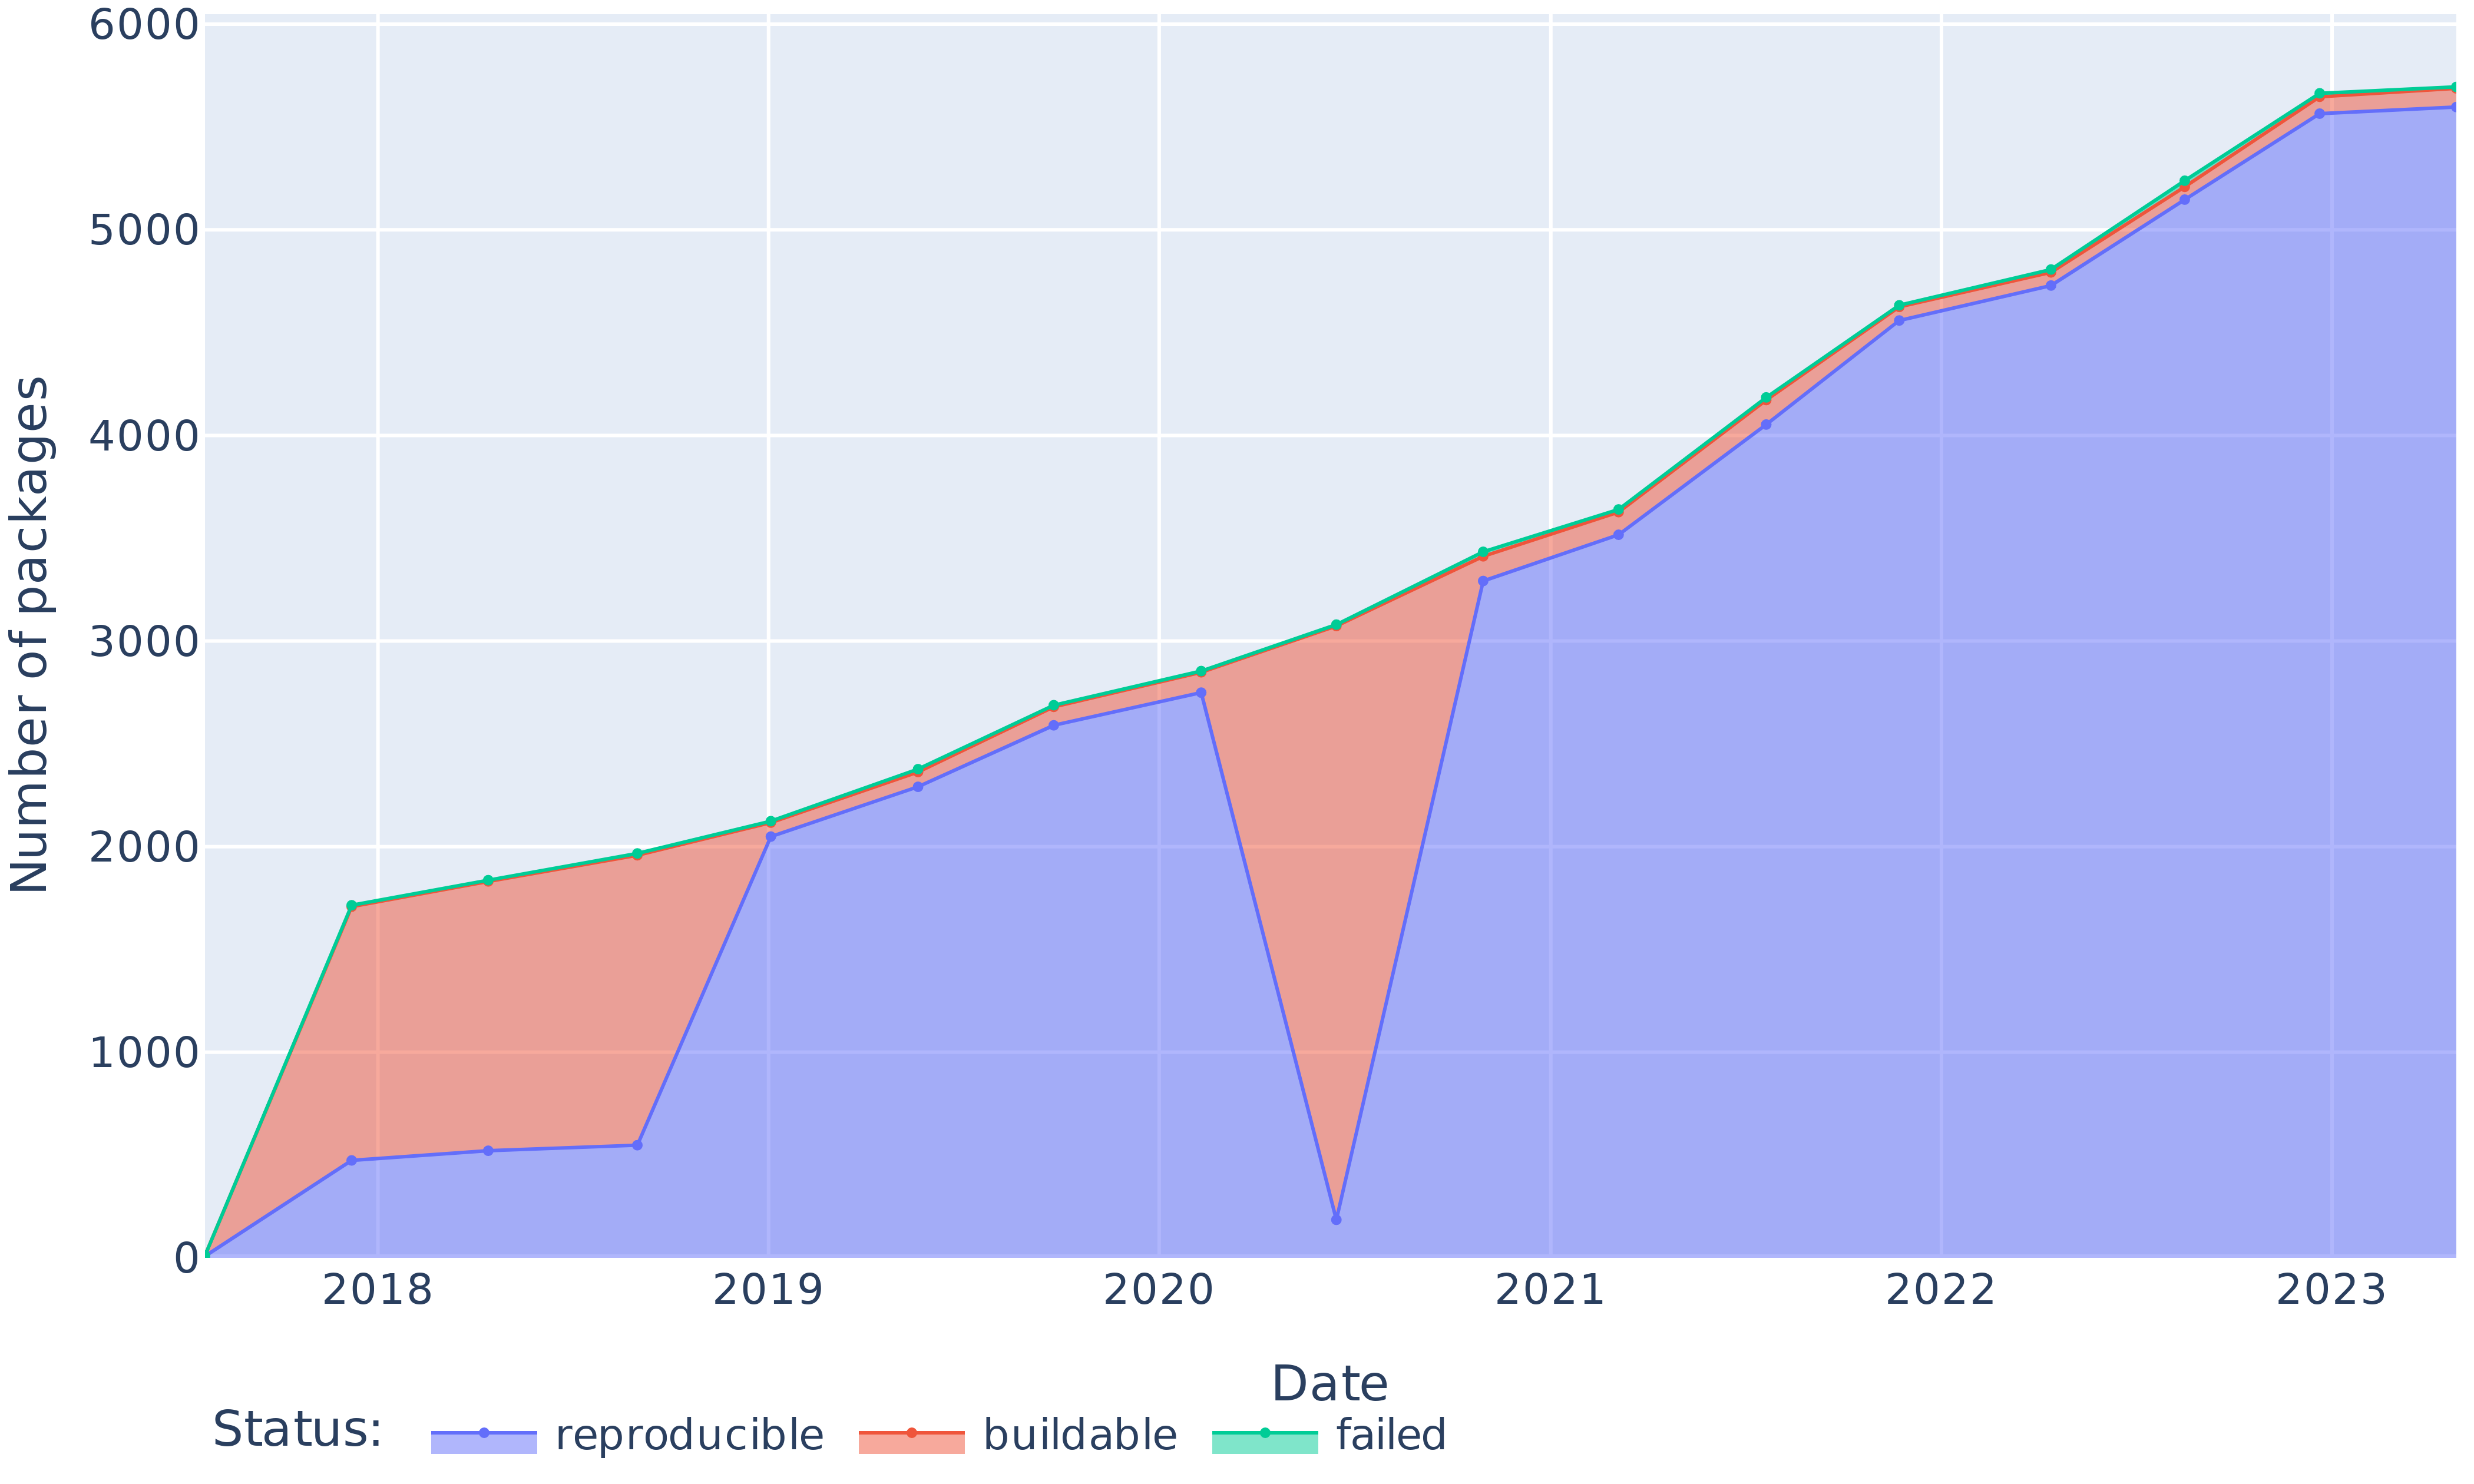
## Stacked Area Chart: Package Build Status Over Time (2018-2023)
### Overview
This is a stacked area chart tracking the number of software packages in three different build statuses over a period from early 2018 to mid-2023. The chart shows the cumulative total of packages and the proportion within each status category over time. The overall trend is one of significant growth in the total number of packages, with a notable anomaly occurring around mid-2020.
### Components/Axes
* **Chart Type:** Stacked Area Chart.
* **X-Axis (Horizontal):** Labeled **"Date"**. It displays yearly markers: **2018, 2019, 2020, 2021, 2022, 2023**. The axis appears to represent a continuous timeline, with data points plotted at regular intervals (likely quarterly or bi-annually) between the year labels.
* **Y-Axis (Vertical):** Labeled **"Number of packages"**. The scale runs from **0 to 6000**, with major gridlines at intervals of 1000 (0, 1000, 2000, 3000, 4000, 5000, 6000).
* **Legend:** Positioned at the **bottom center** of the chart, below the x-axis label. It defines three categories under the heading **"Status:"**:
* **reproducible:** Represented by a **blue** line and filled area.
* **buildable:** Represented by an **orange/salmon** line and filled area.
* **failed:** Represented by a **green/teal** line and filled area.
* **Data Series:** The chart displays three stacked data series. The "reproducible" (blue) series forms the base layer. The "buildable" (orange) series is stacked on top of the blue layer, and the "failed" (green) series is stacked on top of the orange layer. The top green line therefore represents the total number of packages.
### Detailed Analysis
**Trend Verification & Data Points (Approximate Values):**
The chart shows a general upward trend for all three categories, with the total number of packages growing from near zero in early 2018 to approximately 5700 by mid-2023.
* **"reproducible" (Blue Line/Area):**
* **Trend:** Shows a generally increasing trend with a severe, sharp dip in mid-2020.
* **Key Points:** Starts at ~0 (early 2018). Rises to ~500 by mid-2018, ~600 by early 2019, and ~2100 by early 2020. Experiences a dramatic drop to approximately **200** in mid-2020. Recovers sharply to ~3300 by early 2021. Continues growing to ~4100 (early 2022), ~4800 (early 2023), and ends at ~5600 (mid-2023).
* **"buildable" (Orange Line/Area):**
* **Trend:** Shows a steady, consistent upward trend throughout the entire period. The area between the blue and orange lines represents packages that are buildable but not reproducible.
* **Key Points:** The orange line (top of this segment) starts at ~0. It is at ~1700 in mid-2018, ~2100 in early 2019, ~2700 in early 2020, and ~2900 in mid-2020 (during the blue line's dip). It continues to ~3400 (early 2021), ~4200 (early 2022), ~5200 (early 2023), and ends at ~5700 (mid-2023). The thickness of the orange band (buildable but not reproducible) is relatively narrow and consistent, except for a significant widening during the mid-2020 anomaly.
* **"failed" (Green Line/Area):**
* **Trend:** Also shows a steady, consistent upward trend, very closely following the "buildable" line. The area between the orange and green lines represents packages that failed to build.
* **Key Points:** The green line (top of the stack, representing the total) starts at ~0. It is at ~1700 (mid-2018), ~2100 (early 2019), ~2700 (early 2020), ~3100 (mid-2020), ~3500 (early 2021), ~4200 (early 2022), ~5200 (early 2023), and ends at ~5700 (mid-2023). The green "failed" band is very thin throughout, indicating that a very small proportion of the total packages fail to build compared to those that are buildable or reproducible.
### Key Observations
1. **Major Anomaly in Mid-2020:** The most striking feature is the dramatic, V-shaped collapse and recovery of the "reproducible" (blue) package count around the middle of 2020. During this event, the number of reproducible packages plummeted from ~2700 to ~200, while the total package count (green line) continued its steady rise. This caused the "buildable" (orange) segment to become very thick, indicating a massive increase in packages that were buildable but not reproducible during that specific period.
2. **Consistent Growth:** Outside of the 2020 anomaly, all three metrics show strong, consistent growth from 2018 to 2023. The total number of packages increased more than fivefold over the five-year period.
3. **Proportional Relationships:** For most of the timeline, the "reproducible" category constitutes the vast majority of packages. The "buildable but not reproducible" and "failed" categories represent small, relatively stable fractions of the total.
4. **Legend and Color Consistency:** The legend is clearly placed and the colors (blue, orange, green) are consistently applied to their respective data series and filled areas throughout the chart.
### Interpretation
This chart likely tracks the health and reproducibility of a software package repository (like a Linux distribution's package pool) over time. The data suggests:
* **System Expansion:** The repository has been growing rapidly, indicating active development and inclusion of new software.
* **The 2020 Reproducibility Crisis:** The sharp mid-2020 dip in reproducible packages is a critical event. It does not represent a loss of packages (as the total count kept growing), but rather a **systemic failure in the ability to reproduce builds** for a large portion of the existing package set. This could have been caused by a change in the build environment, a toolchain update, a change in the definition of "reproducible," or a widespread issue with timestamps or other non-deterministic elements in the build process. The rapid recovery suggests the issue was identified and remediated, possibly by updating build scripts or infrastructure.
* **High Build Success Rate:** The consistently thin "failed" band indicates that the build infrastructure is generally reliable, with very few packages failing to compile.
* **Reproducibility as the Norm:** Apart from the crisis period, the dominance of the blue area shows that achieving reproducible builds is the standard and successful state for this package ecosystem. The chart serves as a powerful visualization of both long-term progress and the impact of a specific, significant regression in build system integrity.