## Area Chart: Package Status Over Time
### Overview
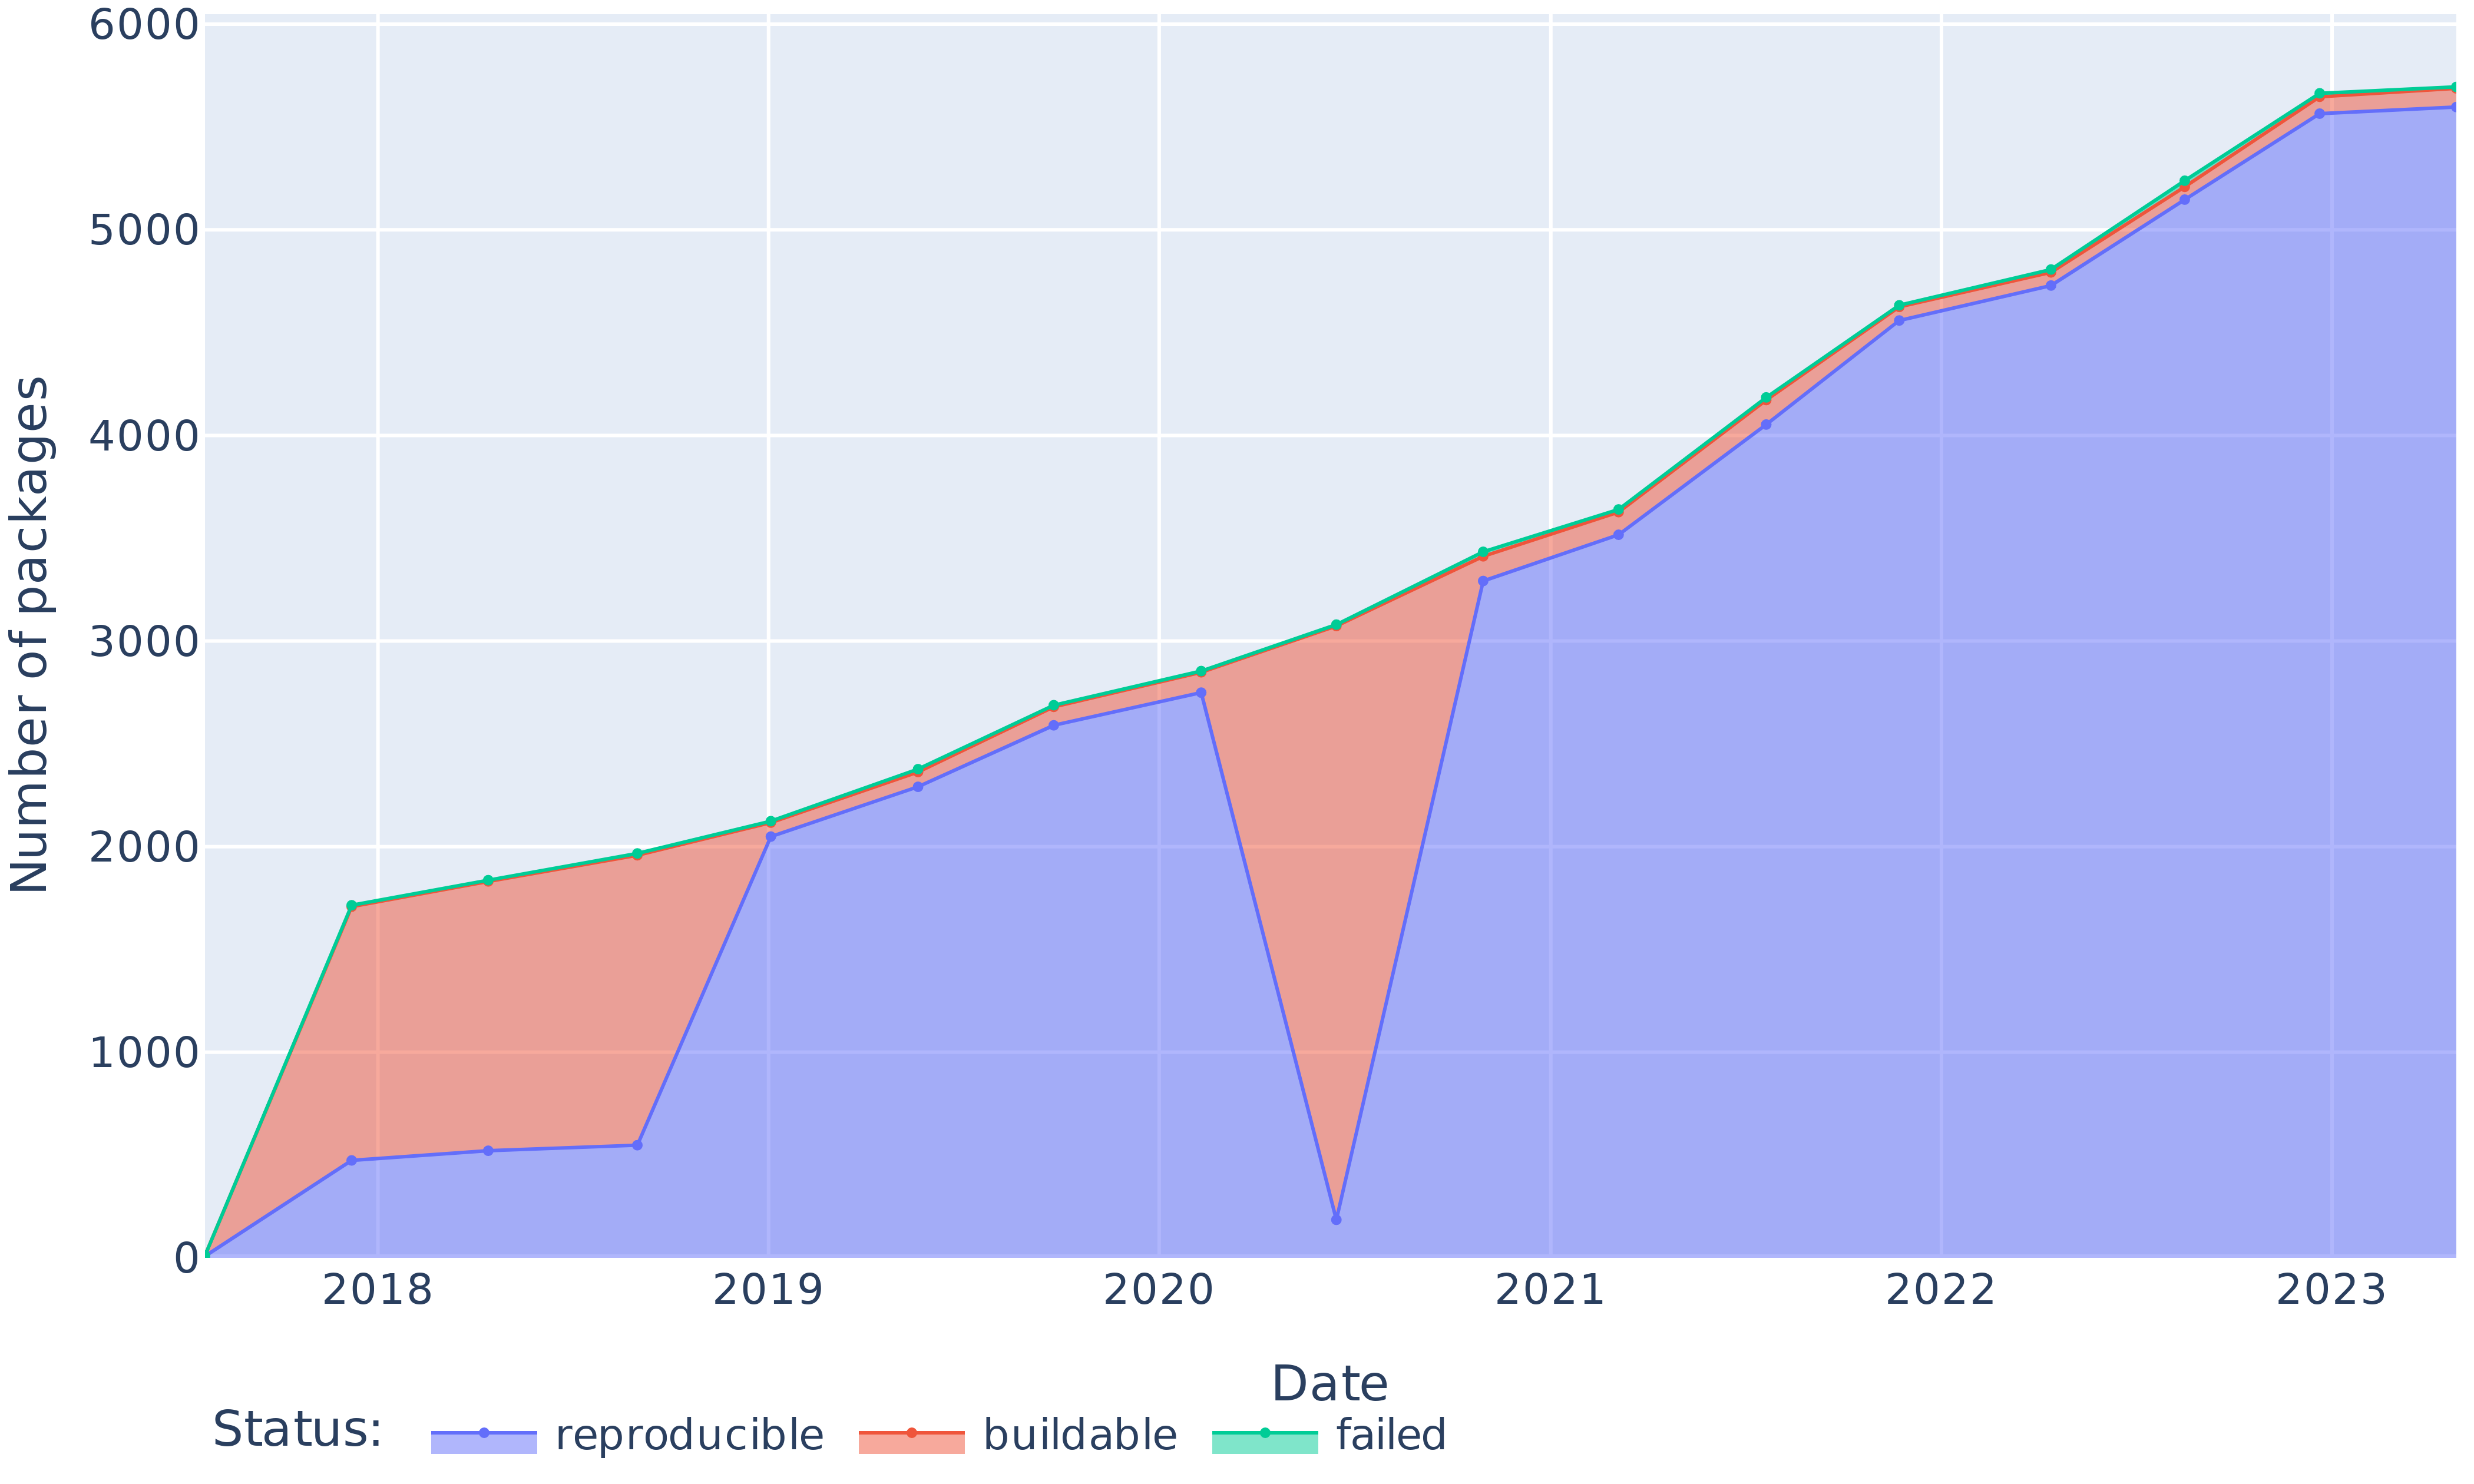
The image is an area chart displaying the number of packages over time, categorized by their status: reproducible, buildable, and failed. The x-axis represents the date from 2018 to 2023, and the y-axis represents the number of packages, ranging from 0 to 6000.
### Components/Axes
* **Title:** None explicitly given in the image.
* **X-axis:** Date, ranging from 2018 to 2023 in yearly increments.
* **Y-axis:** Number of packages, ranging from 0 to 6000 in increments of 1000.
* **Legend:** Located at the bottom-left of the chart.
* Reproducible: Represented by a blue line and filled area.
* Buildable: Represented by a salmon/orange line and filled area.
* Failed: Represented by a teal/green line.
### Detailed Analysis
* **Reproducible Packages (Blue):**
* Trend: Generally increasing over time, with a significant dip in 2020.
* 2018: Approximately 500
* 2019: Approximately 600
* 2020: Approximately 200
* 2021: Approximately 3300
* 2022: Approximately 4600
* 2023: Approximately 5600
* **Buildable Packages (Salmon/Orange):**
* Trend: Increases from 2018 to 2021, then plateaus.
* 2018: Approximately 1700
* 2019: Approximately 2200
* 2020: Approximately 2800
* 2021: Approximately 3600
* 2022: Approximately 4700
* 2023: Approximately 5700
* **Failed Packages (Teal/Green):**
* Trend: Generally increasing over time.
* 2018: Approximately 1700
* 2019: Approximately 2200
* 2020: Approximately 2900
* 2021: Approximately 3600
* 2022: Approximately 4700
* 2023: Approximately 5700
### Key Observations
* The number of reproducible packages experienced a sharp decline in 2020 before recovering and increasing significantly in subsequent years.
* The number of buildable packages appears to plateau after 2021, closely tracking the number of failed packages.
* The number of failed packages consistently increases over the years.
* The total number of packages (represented by the top of the "failed" area) shows a steady increase from 2018 to 2023.
### Interpretation
The chart illustrates the evolution of package status over time. The dip in reproducible packages in 2020 could indicate a change in build processes or testing procedures that temporarily affected reproducibility. The subsequent recovery and growth suggest that these issues were addressed. The plateau in buildable packages, coupled with the continued increase in failed packages, might indicate increasing complexity or stricter testing criteria, leading to more packages failing to meet the build requirements. Overall, the chart suggests a growing ecosystem of packages with ongoing efforts to improve reproducibility and build success.