\n
## Area Chart: Package Status Over Time
### Overview
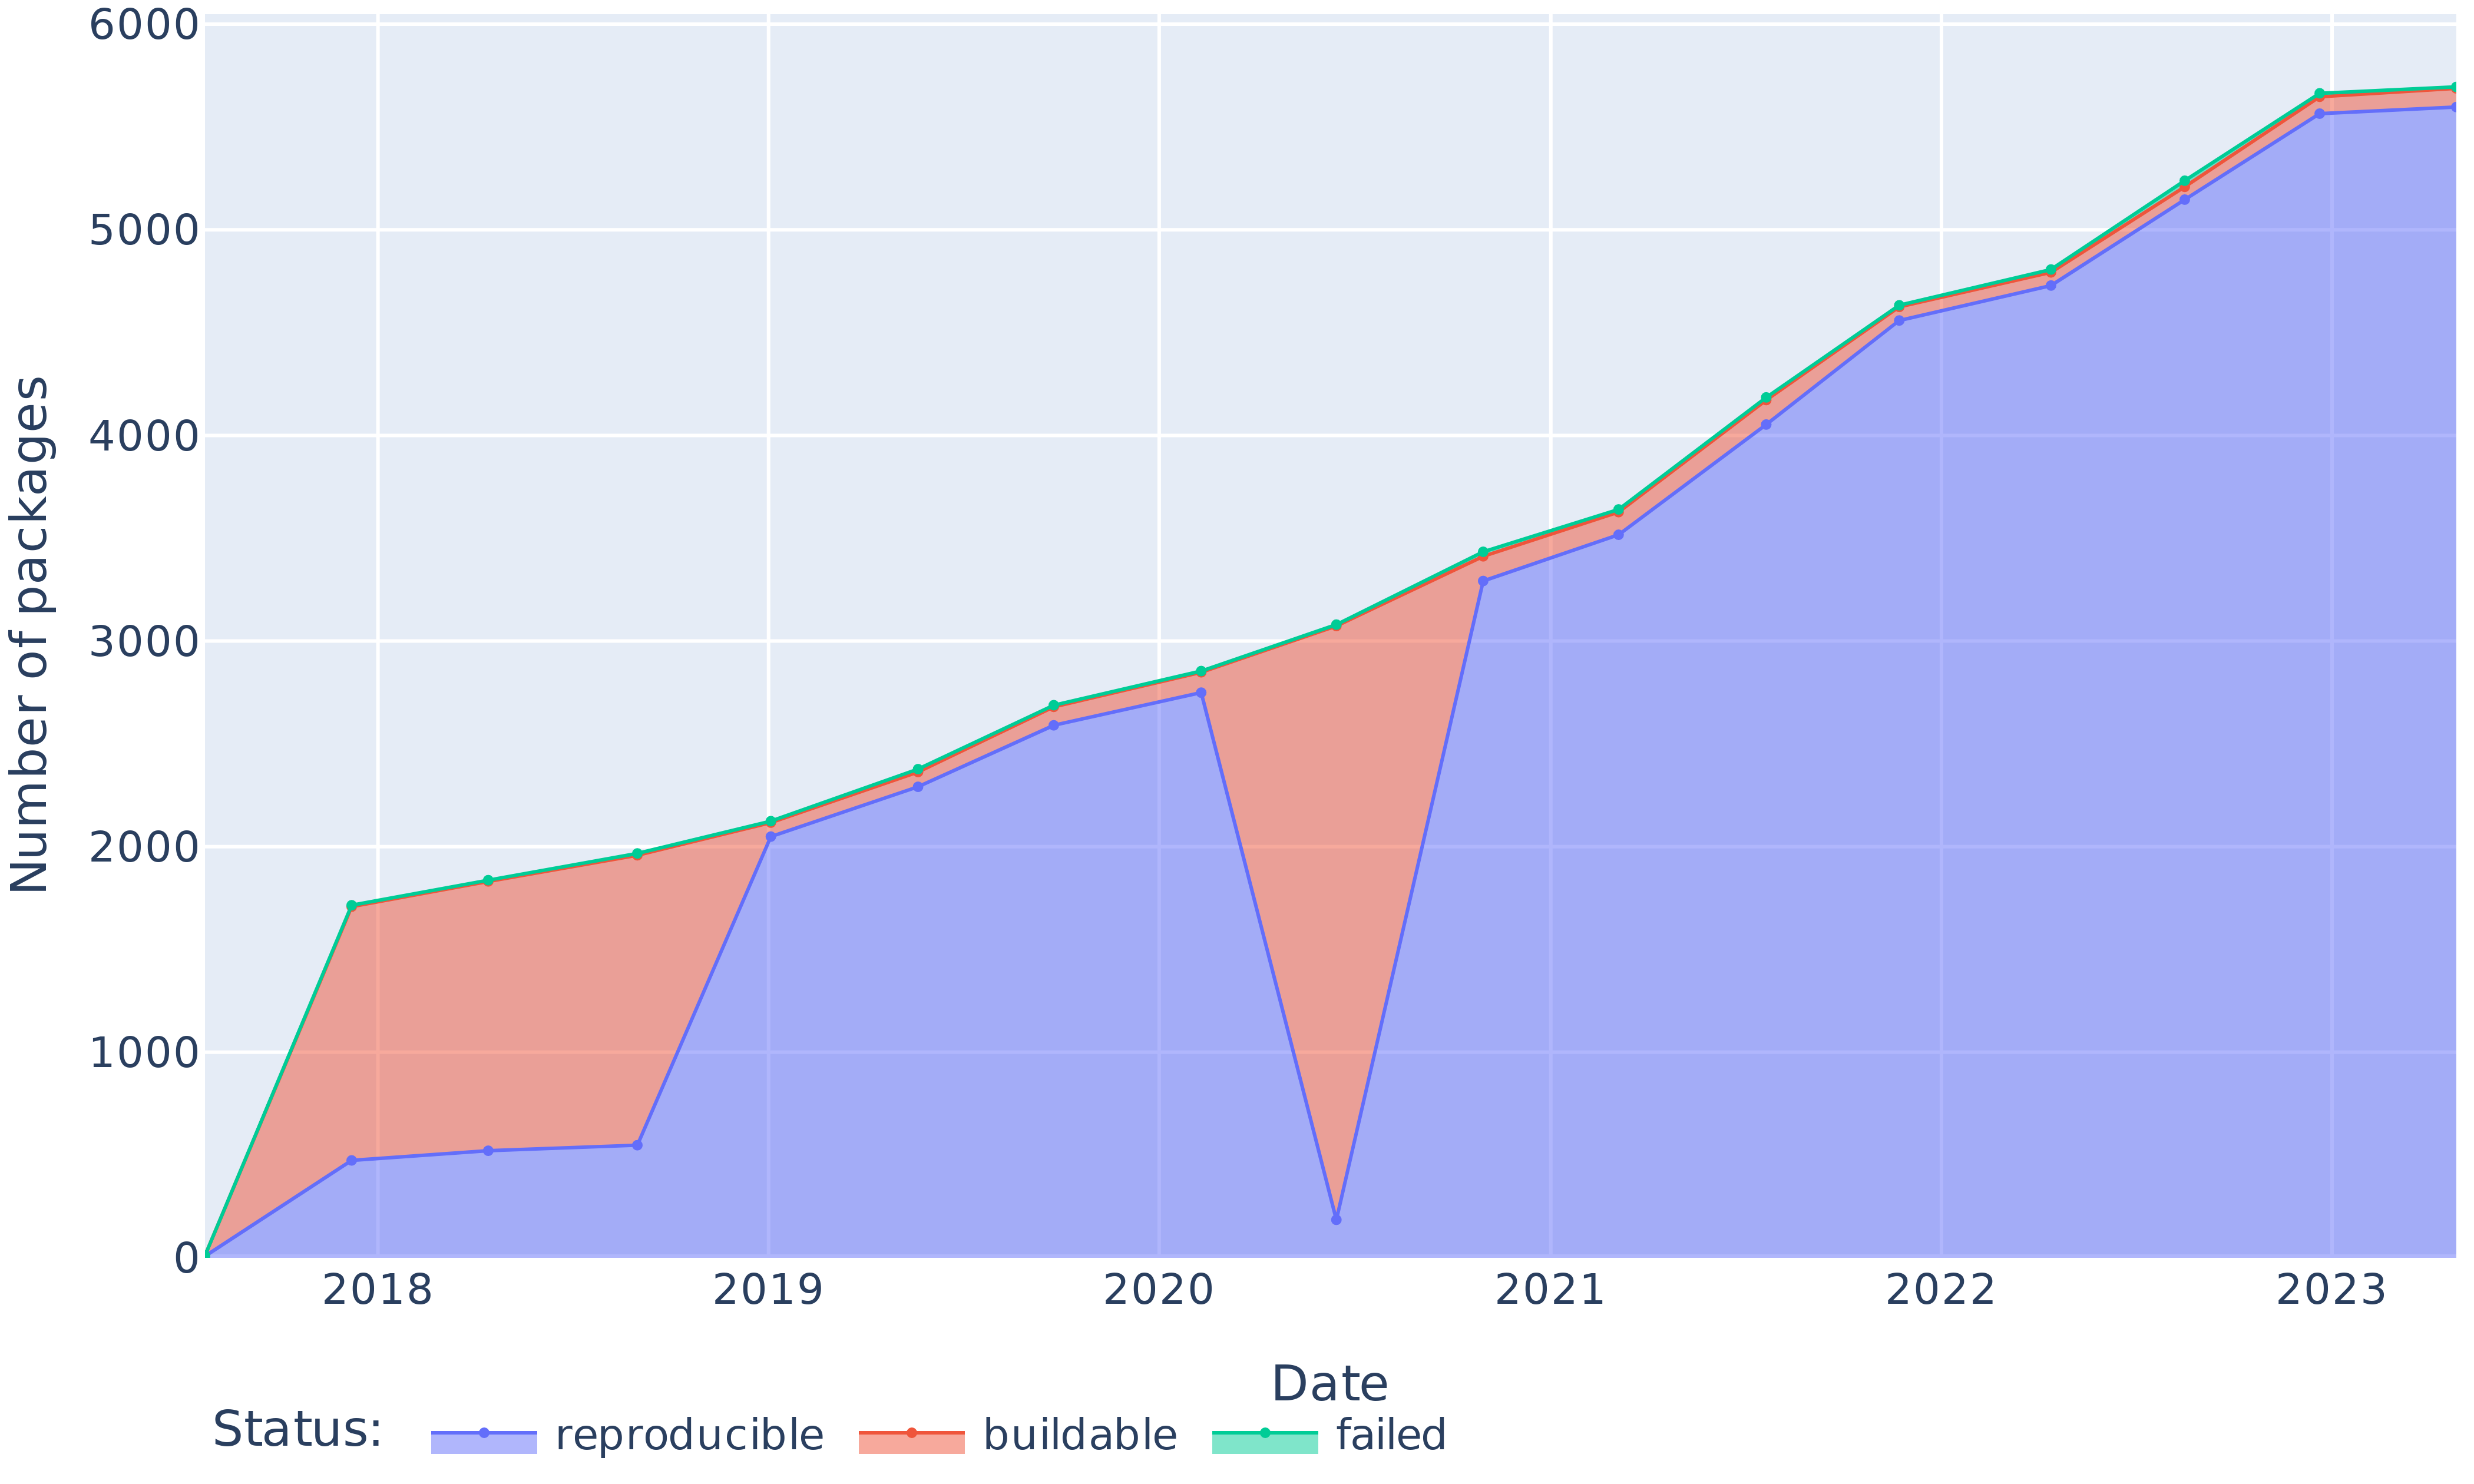
This area chart depicts the number of software packages over time (2018-2023), categorized by their build status: reproducible, buildable, and failed. The chart uses stacked areas to show the cumulative number of packages for each status.
### Components/Axes
* **X-axis:** Date, ranging from 2018 to 2023, with yearly markers.
* **Y-axis:** Number of packages, ranging from 0 to 6000, with increments of 1000.
* **Legend (bottom-center):**
* Reproducible (Blue)
* Buildable (Red)
* Failed (Green)
* **Title:** Not explicitly present, but the chart represents "Package Status" over time.
### Detailed Analysis
The chart shows three data series, each representing a build status.
* **Reproducible (Blue):** This line starts at approximately 200 packages in 2018 and steadily increases to around 5700 packages in 2023. The line slopes consistently upward, indicating a continuous increase in the number of reproducible packages.
* 2018: ~200 packages
* 2019: ~800 packages
* 2020: ~1800 packages
* 2021: ~3300 packages
* 2022: ~4400 packages
* 2023: ~5700 packages
* **Buildable (Red):** This line begins at approximately 500 packages in 2018 and increases to around 3000 packages in 2023. The line shows a generally upward trend, but with some fluctuations.
* 2018: ~500 packages
* 2019: ~1300 packages
* 2020: ~2400 packages
* 2021: ~3200 packages
* 2022: ~3300 packages
* 2023: ~3000 packages
* **Failed (Green):** This line starts at approximately 100 packages in 2018, rises to a peak of around 1000 packages in 2020, then dramatically drops to near zero in 2021, and remains low through 2023.
* 2018: ~100 packages
* 2019: ~400 packages
* 2020: ~1000 packages
* 2021: ~100 packages
* 2022: ~200 packages
* 2023: ~100 packages
The total number of packages (sum of all three statuses) increases over time, from approximately 800 in 2018 to around 9000 in 2023.
### Key Observations
* The number of reproducible packages consistently increases over the entire period.
* The number of buildable packages also increases, but at a slower rate than reproducible packages, and plateaus in 2022-2023.
* The number of failed packages peaked in 2020 and has since decreased significantly, suggesting improvements in the build process.
* The largest increase in total packages occurred between 2020 and 2021.
### Interpretation
The data suggests a positive trend in the software package ecosystem, with an increasing number of packages becoming reproducible and buildable. The significant reduction in failed packages indicates improvements in build infrastructure or package quality control. The consistent growth of reproducible packages is particularly encouraging, as it suggests increased reliability and trustworthiness of the software. The plateauing of buildable packages in recent years might warrant further investigation to identify potential bottlenecks or areas for improvement. The spike in failed packages in 2020 could be attributed to a specific event or change in the build environment that year. The stacked area chart effectively visualizes the composition of the package ecosystem over time, highlighting the relative proportions of each build status.