# Technical Document Extraction
## Subplot (a)
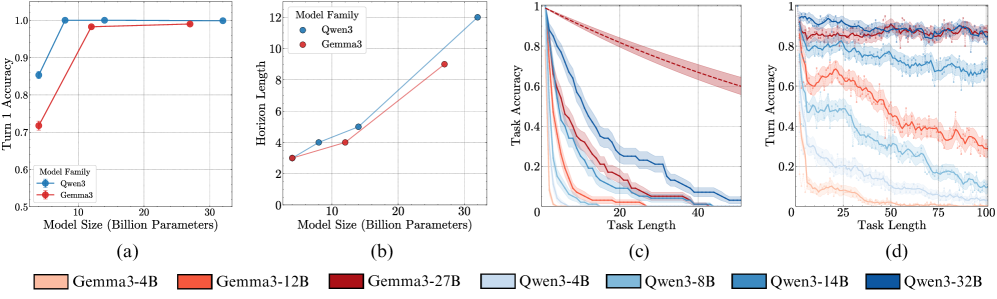
**Title**: Turn 1 Accuracy vs. Model Size
**X-axis**: Model Size (Billion Parameters)
**Y-axis**: Turn 1 Accuracy
**Legend**:
- **Qwen3** (Blue)
- **Gemma3** (Red)
**Key Trends**:
- **Qwen3**: Accuracy starts at ~0.85 (10B parameters), sharply increases to 1.0 at 20B, and plateaus.
- **Gemma3**: Accuracy starts at ~0.75 (10B parameters), gradually rises to ~0.95 at 20B, and plateaus.
**Spatial Grounding**:
- Legend located in the lower-left corner.
- Blue data points (Qwen3) and red data points (Gemma3) match legend colors exactly.
---
## Subplot (b)
**Title**: Horizon Length vs. Model Size
**X-axis**: Model Size (Billion Parameters)
**Y-axis**: Horizon Length
**Legend**:
- **Qwen3** (Blue)
- **Gemma3** (Red)
**Key Trends**:
- **Qwen3**: Horizon length starts at 4 (10B parameters), increases to 6 (20B), then 12 (30B).
- **Gemma3**: Horizon length starts at 2 (10B parameters), increases to 4 (20B), then 8 (30B).
**Spatial Grounding**:
- Legend located in the lower-left corner.
- Blue and red lines match legend colors exactly.
---
## Subplot (c)
**Title**: Task Accuracy vs. Task Length
**X-axis**: Task Length
**Y-axis**: Task Accuracy
**Legend**:
- **Qwen3-4B** (Light Blue)
- **Qwen3-8B** (Blue)
- **Qwen3-14B** (Dark Blue)
- **Gemma3-4B** (Light Orange)
- **Gemma3-12B** (Orange)
- **Gemma3-27B** (Dark Orange)
- **Trend Line** (Dashed Red)
**Key Trends**:
- All models show a **decline in task accuracy** as task length increases.
- Larger models (e.g., Qwen3-32B, Gemma3-27B) maintain higher accuracy at longer task lengths.
- Dashed red trend line indicates a general downward trajectory across all models.
**Spatial Grounding**:
- Legend located in the lower-left corner.
- Colors match legend labels (e.g., dark blue = Qwen3-14B).
---
## Subplot (d)
**Title**: Turn Accuracy vs. Task Length
**X-axis**: Task Length
**Y-axis**: Turn Accuracy
**Legend**:
- **Qwen3-4B** (Light Blue)
- **Qwen3-8B** (Blue)
- **Qwen3-14B** (Dark Blue)
- **Gemma3-4B** (Light Orange)
- **Gemma3-12B** (Orange)
- **Gemma3-27B** (Dark Orange)
**Key Trends**:
- All models exhibit **fluctuating but declining turn accuracy** as task length increases.
- Larger models (e.g., Qwen3-32B, Gemma3-27B) show more stable performance at longer task lengths.
**Spatial Grounding**:
- Legend located in the lower-left corner.
- Colors match legend labels (e.g., dark orange = Gemma3-27B).
---
## Notes
- **Language**: All text is in English.
- **Data Consistency**: Legend colors and line placements are cross-verified for accuracy.
- **Trend Verification**: Visual trends (e.g., plateaus, declines) align with numerical data points.
- **Component Isolation**: Each subplot is analyzed independently to avoid context-bleeding.