## Bar Chart: Model Prediction Performance
### Overview
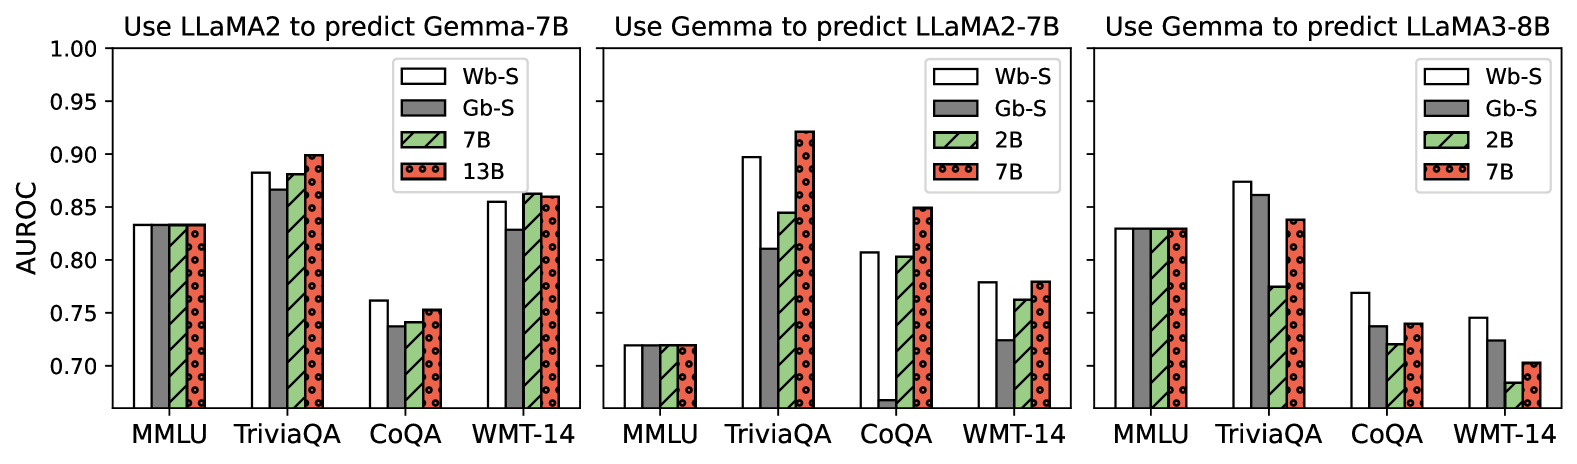
The image presents three bar charts comparing the performance (AUROC score) of different language models when predicting the outputs of other models. The charts are grouped by the model used for prediction: LLaMA2 predicting Gemma-7B, Gemma predicting LLaMA2-7B, and Gemma predicting LLaMA3-8B. Each chart compares the performance across four tasks: MMLU, TriviaQA, CoQA, and WMT-14.
### Components/Axes
* **Title (Top-Left Chart):** Use LLaMA2 to predict Gemma-7B
* **Title (Top-Middle Chart):** Use Gemma to predict LLaMA2-7B
* **Title (Top-Right Chart):** Use Gemma to predict LLaMA3-8B
* **Y-axis Label:** AUROC
* Scale: 0.70 to 1.00, with tick marks at 0.70, 0.75, 0.80, 0.85, 0.90, 0.95, and 1.00.
* **X-axis Labels (all charts):** MMLU, TriviaQA, CoQA, WMT-14
* **Legend (Top-Left Chart):**
* White: Wb-S
* Gray: Gb-S
* Green (diagonal lines): 7B
* Red (dotted): 13B
* **Legend (Top-Middle and Top-Right Charts):**
* White: Wb-S
* Gray: Gb-S
* Green (diagonal lines): 2B
* Red (dotted): 7B
### Detailed Analysis
#### Chart 1: Use LLaMA2 to predict Gemma-7B
* **MMLU:**
* Wb-S: ~0.84
* Gb-S: ~0.84
* 7B: ~0.84
* 13B: ~0.84
* **TriviaQA:**
* Wb-S: ~0.88
* Gb-S: ~0.87
* 7B: ~0.89
* 13B: ~0.90
* **CoQA:**
* Wb-S: ~0.76
* Gb-S: ~0.74
* 7B: ~0.74
* 13B: ~0.75
* **WMT-14:**
* Wb-S: ~0.86
* Gb-S: ~0.85
* 7B: ~0.86
* 13B: ~0.86
#### Chart 2: Use Gemma to predict LLaMA2-7B
* **MMLU:**
* Wb-S: ~0.72
* Gb-S: ~0.72
* 2B: ~0.72
* 7B: ~0.72
* **TriviaQA:**
* Wb-S: ~0.89
* Gb-S: ~0.83
* 2B: ~0.80
* 7B: ~0.88
* **CoQA:**
* Wb-S: ~0.72
* Gb-S: ~0.80
* 2B: ~0.84
* 7B: ~0.87
* **WMT-14:**
* Wb-S: ~0.77
* Gb-S: ~0.78
* 2B: ~0.80
* 7B: ~0.85
#### Chart 3: Use Gemma to predict LLaMA3-8B
* **MMLU:**
* Wb-S: ~0.84
* Gb-S: ~0.84
* 2B: ~0.84
* 7B: ~0.84
* **TriviaQA:**
* Wb-S: ~0.88
* Gb-S: ~0.87
* 2B: ~0.86
* 7B: ~0.82
* **CoQA:**
* Wb-S: ~0.77
* Gb-S: ~0.74
* 2B: ~0.74
* 7B: ~0.74
* **WMT-14:**
* Wb-S: ~0.74
* Gb-S: ~0.72
* 2B: ~0.68
* 7B: ~0.70
### Key Observations
* When LLaMA2 predicts Gemma-7B, the performance across different tasks is relatively consistent for all model sizes (Wb-S, Gb-S, 7B, 13B). TriviaQA shows the highest AUROC scores, while CoQA shows the lowest.
* When Gemma predicts LLaMA2-7B, there is more variance in performance across tasks and model sizes. TriviaQA and CoQA show higher AUROC scores compared to MMLU and WMT-14.
* When Gemma predicts LLaMA3-8B, the performance is generally high for MMLU and TriviaQA, but lower for CoQA and WMT-14.
### Interpretation
The charts illustrate the transferability and predictive power of different language models. The AUROC scores indicate how well one model can predict the output of another on various tasks.
* The first chart suggests that LLaMA2 can effectively predict Gemma-7B's outputs, with relatively consistent performance across different model sizes.
* The second chart shows that Gemma's ability to predict LLaMA2-7B varies depending on the task. This could indicate differences in the models' architectures or training data.
* The third chart shows that Gemma's ability to predict LLaMA3-8B also varies depending on the task.
The differences in performance across tasks (MMLU, TriviaQA, CoQA, WMT-14) highlight the importance of task-specific evaluation when assessing language model capabilities. The models seem to perform better on TriviaQA compared to CoQA, suggesting that they are better at answering factual questions than engaging in conversational question answering.