## Bar Chart: AUROC Performance of LLMs Predicting Other LLMs
### Overview
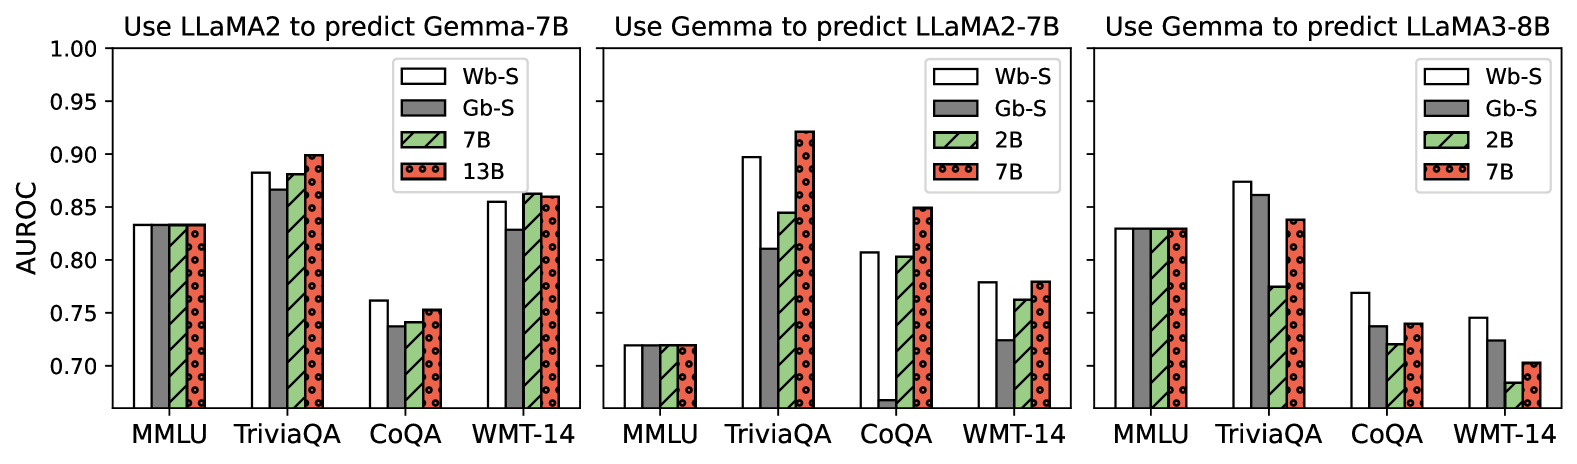
This image presents three sets of bar charts comparing the Area Under the Receiver Operating Characteristic curve (AUROC) performance of different Large Language Models (LLMs) when predicting the outputs of other LLMs. Each set of charts corresponds to a different prediction scenario: using LLaMA2 to predict Gemma-7B, using Gemma to predict LLaMA2-7B, and using Gemma to predict LLaMA3-8B. The x-axis represents different datasets (MMLU, TriviaQA, CoQA, WMT-14), and the y-axis represents the AUROC score. Different LLM sizes are represented by different bar patterns.
### Components/Axes
* **Title (Top):** "Use LLaMA2 to predict Gemma-7B", "Use Gemma to predict LLaMA2-7B", "Use Gemma to predict LLaMA3-8B"
* **X-axis Label:** Dataset names: MMLU, TriviaQA, CoQA, WMT-14
* **Y-axis Label:** AUROC (ranging from approximately 0.70 to 1.00)
* **Legend (Top-Right of each chart):**
* "Wb-S" (White bars with solid fill)
* "Gb-S" (Gray bars with solid fill)
* "2B" (Light green bars with dotted fill)
* "7B" (Dark green bars with striped fill)
* "13B" (Red bars with cross-hatched fill)
### Detailed Analysis or Content Details
**Chart 1: Use LLaMA2 to predict Gemma-7B**
* **MMLU:**
* Wb-S: Approximately 0.88
* Gb-S: Approximately 0.87
* 7B: Approximately 0.86
* 13B: Approximately 0.84
* **TriviaQA:**
* Wb-S: Approximately 0.89
* Gb-S: Approximately 0.88
* 7B: Approximately 0.87
* 13B: Approximately 0.85
* **CoQA:**
* Wb-S: Approximately 0.84
* Gb-S: Approximately 0.83
* 7B: Approximately 0.81
* 13B: Approximately 0.78
* **WMT-14:**
* Wb-S: Approximately 0.86
* Gb-S: Approximately 0.85
* 7B: Approximately 0.83
* 13B: Approximately 0.79
**Chart 2: Use Gemma to predict LLaMA2-7B**
* **MMLU:**
* Wb-S: Approximately 0.73
* Gb-S: Approximately 0.72
* 2B: Approximately 0.71
* 7B: Approximately 0.70
* **TriviaQA:**
* Wb-S: Approximately 0.88
* Gb-S: Approximately 0.87
* 2B: Approximately 0.85
* 7B: Approximately 0.83
* **CoQA:**
* Wb-S: Approximately 0.78
* Gb-S: Approximately 0.77
* 2B: Approximately 0.75
* 7B: Approximately 0.73
* **WMT-14:**
* Wb-S: Approximately 0.74
* Gb-S: Approximately 0.73
* 2B: Approximately 0.71
* 7B: Approximately 0.69
**Chart 3: Use Gemma to predict LLaMA3-8B**
* **MMLU:**
* Wb-S: Approximately 0.88
* Gb-S: Approximately 0.87
* 2B: Approximately 0.85
* 7B: Approximately 0.83
* **TriviaQA:**
* Wb-S: Approximately 0.91
* Gb-S: Approximately 0.90
* 2B: Approximately 0.88
* 7B: Approximately 0.86
* **CoQA:**
* Wb-S: Approximately 0.85
* Gb-S: Approximately 0.84
* 2B: Approximately 0.82
* 7B: Approximately 0.80
* **WMT-14:**
* Wb-S: Approximately 0.78
* Gb-S: Approximately 0.77
* 2B: Approximately 0.75
* 7B: Approximately 0.73
### Key Observations
* In the first chart (LLaMA2 predicting Gemma-7B), the performance is relatively high across all datasets and model sizes, with Wb-S consistently performing slightly better than the others.
* In the second chart (Gemma predicting LLaMA2-7B), the AUROC scores are generally lower, particularly on the MMLU dataset.
* In the third chart (Gemma predicting LLaMA3-8B), the performance is higher than in the second chart, but still generally lower than in the first chart.
* Across all charts, larger model sizes (7B and 13B) generally perform better than smaller models (2B), but the difference is not always substantial.
* TriviaQA consistently shows the highest AUROC scores across all scenarios.
### Interpretation
The data suggests that predicting the output of a model with a different architecture (e.g., LLaMA2 predicting Gemma) can be more effective than predicting the output of a model with the same architecture (e.g., Gemma predicting LLaMA2). This could be due to the differences in the training data or model structure leading to complementary strengths. The performance on TriviaQA is consistently high, indicating that this dataset may be easier to predict or that the models are particularly well-suited to this type of question answering. The varying performance across datasets highlights the importance of evaluating models on a diverse range of tasks. The trend of larger models generally performing better suggests that model size is an important factor in prediction accuracy, but other factors, such as architecture and training data, also play a significant role. The differences in performance between the three prediction scenarios suggest that the choice of predictor and predicttee models can have a substantial impact on the accuracy of the prediction.