## Bar Chart: Model Performance Comparison Across Tasks and Scenarios
### Overview
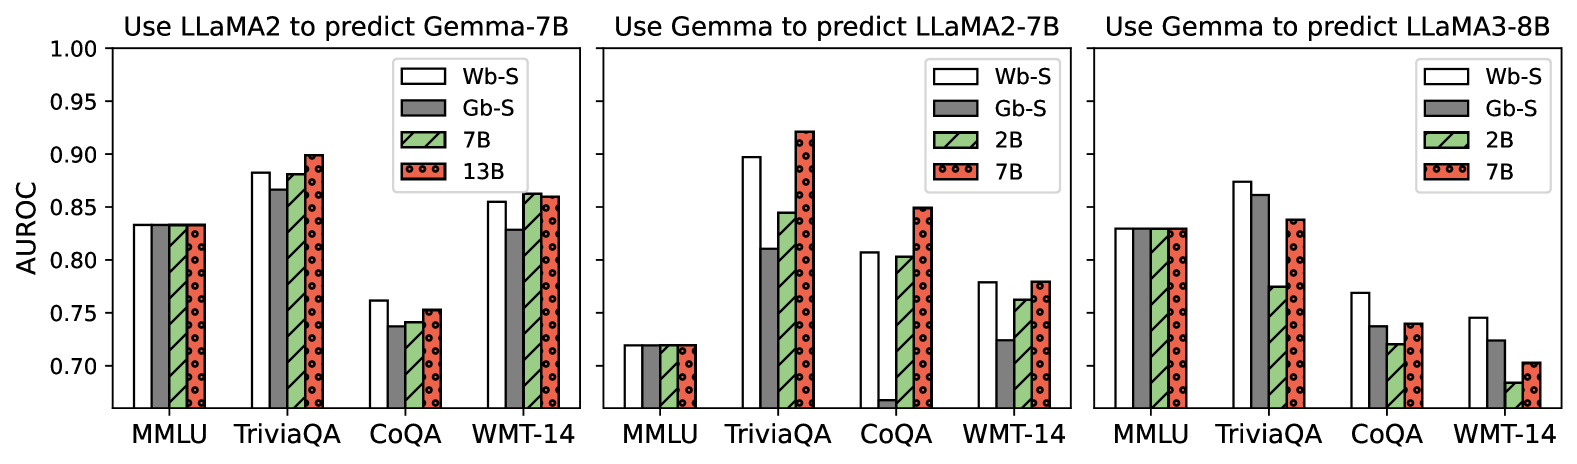
The image contains three grouped bar charts comparing the performance of four models (Wb-S, Gb-S, 7B, 13B) across four tasks (MMLU, TriviaQA, CoQA, WMT-14) in three scenarios:
1. **Use LLaMA2 to predict Gemma-7B**
2. **Use Gemma to predict LLaMA2-7B**
3. **Use Gemma to predict LLaMA3-8B**
Performance is measured using the **AUROC metric** (0.7–1.0 scale).
---
### Components/Axes
- **X-Axis**: Tasks (MMLU, TriviaQA, CoQA, WMT-14)
- **Y-Axis**: AUROC (0.7–1.0)
- **Legend**:
- **Wb-S**: White bars
- **Gb-S**: Gray bars
- **7B**: Green bars with diagonal hatching
- **13B**: Red bars with dotted patterns
- **Chart Titles**: Positioned at the top of each subplot.
- **Bar Grouping**: Each task has four bars (one per model), grouped by task.
---
### Detailed Analysis
#### **1. Use LLaMA2 to predict Gemma-7B**
- **MMLU**:
- Wb-S: ~0.84 | Gb-S: ~0.83 | 7B: ~0.84 | 13B: ~0.84
- **TriviaQA**:
- Wb-S: ~0.88 | Gb-S: ~0.87 | 7B: ~0.88 | 13B: ~0.90
- **CoQA**:
- Wb-S: ~0.76 | Gb-S: ~0.74 | 7B: ~0.75 | 13B: ~0.76
- **WMT-14**:
- Wb-S: ~0.86 | Gb-S: ~0.84 | 7B: ~0.86 | 13B: ~0.85
#### **2. Use Gemma to predict LLaMA2-7B**
- **MMLU**:
- Wb-S: ~0.72 | Gb-S: ~0.72 | 7B: ~0.72 | 13B: ~0.72
- **TriviaQA**:
- Wb-S: ~0.90 | Gb-S: ~0.82 | 7B: ~0.85 | 13B: ~0.92
- **CoQA**:
- Wb-S: ~0.80 | Gb-S: ~0.05 (outlier) | 7B: ~0.78 | 13B: ~0.85
- **WMT-14**:
- Wb-S: ~0.78 | Gb-S: ~0.72 | 7B: ~0.76 | 13B: ~0.79
#### **3. Use Gemma to predict LLaMA3-8B**
- **MMLU**:
- Wb-S: ~0.83 | Gb-S: ~0.83 | 7B: ~0.83 | 13B: ~0.83
- **TriviaQA**:
- Wb-S: ~0.87 | Gb-S: ~0.86 | 7B: ~0.78 | 13B: ~0.84
- **CoQA**:
- Wb-S: ~0.77 | Gb-S: ~0.74 | 7B: ~0.73 | 13B: ~0.74
- **WMT-14**:
- Wb-S: ~0.74 | Gb-S: ~0.72 | 7B: ~0.68 | 13B: ~0.70
---
### Key Observations
1. **Consistency Across Scenarios**:
- Wb-S and Gb-S show relatively stable performance across tasks and scenarios.
- 7B and 13B models exhibit task-specific variability.
2. **Outliers**:
- **Gb-S in CoQA (Scenario 2)**: AUROC drops to ~0.05, suggesting a critical failure or overfitting.
- **7B in WMT-14 (Scenario 3)**: AUROC plummets to ~0.68, indicating poor generalization.
3. **Trends**:
- **Larger Models (13B)**: Outperform smaller models in TriviaQA (Scenario 1 and 2) but underperform in CoQA (Scenario 3).
- **Gemma’s Effectiveness**: Varies by target model size. For example, Gemma predicts LLaMA2-7B better than LLaMA3-8B in TriviaQA.
---
### Interpretation
- **Model Generalization**:
- Wb-S and Gb-S demonstrate robustness across tasks, while 7B and 13B models show task-dependent performance.
- The 13B model excels in TriviaQA (Scenario 1 and 2) but struggles in CoQA (Scenario 3), suggesting over-reliance on specific training data.
- **Gemma’s Role**:
- Gemma’s predictive accuracy depends on the target model’s architecture. For instance, it performs better with LLaMA2-7B in TriviaQA but worse with LLaMA3-8B in CoQA.
- **Anomalies**:
- The extreme drop in Gb-S (Scenario 2, CoQA) highlights potential instability in smaller models under certain prediction scenarios.
- **Practical Implications**:
- Larger models (13B) may not always outperform smaller ones, emphasizing the need for task-specific tuning.
- Gemma’s utility as a predictor is context-dependent, requiring careful model selection based on the target architecture.