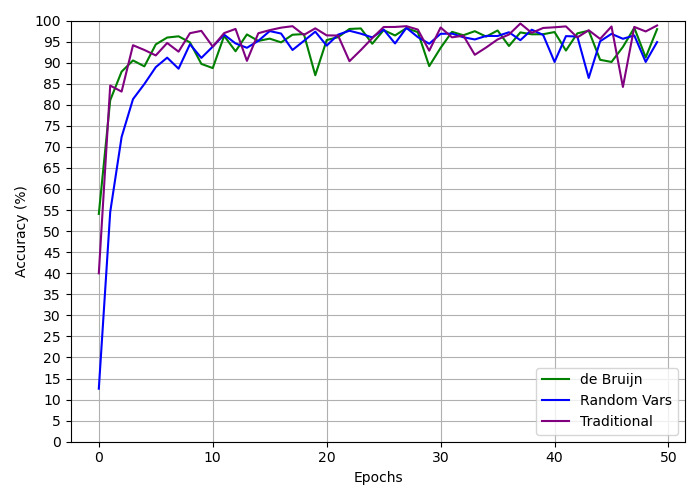
## Line Chart: Accuracy vs. Epochs for Different Methods
### Overview
The image is a line chart comparing the accuracy of three different methods ("de Bruijn", "Random Vars", and "Traditional") over 50 epochs. The chart displays accuracy (in percentage) on the y-axis and the number of epochs on the x-axis. All three methods show a rapid increase in accuracy in the initial epochs, followed by a plateauing effect as the number of epochs increases.
### Components/Axes
* **X-axis:** Epochs, ranging from 0 to 50, with tick marks at intervals of 10.
* **Y-axis:** Accuracy (%), ranging from 0 to 100, with tick marks at intervals of 5.
* **Legend:** Located in the bottom-right corner, it identifies the three methods:
* Green line: "de Bruijn"
* Dark Blue line: "Random Vars"
* Purple line: "Traditional"
* **Gridlines:** Present in the background to aid in reading the values.
### Detailed Analysis
* **de Bruijn (Green):**
* Trend: Rapid increase in accuracy from epoch 0 to approximately epoch 5, followed by a gradual increase and plateauing.
* Approximate values: Starts around 52% at epoch 0, reaches approximately 90% by epoch 5, and fluctuates between 90% and 98% from epoch 20 onwards.
* **Random Vars (Dark Blue):**
* Trend: Rapid increase in accuracy from epoch 0 to approximately epoch 5, followed by a gradual increase and plateauing.
* Approximate values: Starts around 12% at epoch 0, reaches approximately 85% by epoch 5, and fluctuates between 92% and 98% from epoch 20 onwards.
* **Traditional (Purple):**
* Trend: Rapid increase in accuracy from epoch 0 to approximately epoch 5, followed by a gradual increase and plateauing.
* Approximate values: Starts around 45% at epoch 0, reaches approximately 82% by epoch 5, and fluctuates between 92% and 99% from epoch 20 onwards.
### Key Observations
* All three methods exhibit a similar trend: a rapid initial increase in accuracy followed by a plateau.
* The "Traditional" method appears to achieve slightly higher peak accuracy values compared to the other two methods, especially after epoch 20.
* The "Random Vars" method starts with the lowest initial accuracy but catches up to the other methods relatively quickly.
* After approximately 20 epochs, the accuracy of all three methods fluctuates within a narrow range (90% to 99%).
### Interpretation
The chart suggests that all three methods are effective in achieving high accuracy, but they differ in their initial learning rates. The "Traditional" method might have a slight advantage in terms of peak accuracy, but the differences become less significant as the number of epochs increases. The rapid increase in accuracy during the initial epochs indicates that the models learn quickly, and the plateauing effect suggests that further training beyond a certain number of epochs may not significantly improve performance. The fluctuations in accuracy after the plateau could be due to the inherent variability in the training data or the learning process.